

You can hit a strong sales month and still feel poorer afterward. Inventory arrives late, suppliers want payment now, returns eat margin, and the ad account keeps asking for more cash. The dashboard says growth. Your bank balance tells a different story.
I've seen founders scale the wrong bottleneck, then blame marketing when operations break. If you want to know how to grow ecommerce business profitably, start with cash timing, contribution margin, fulfillment, and repeat purchases. Traffic matters, but traffic only magnifies the system you already have.
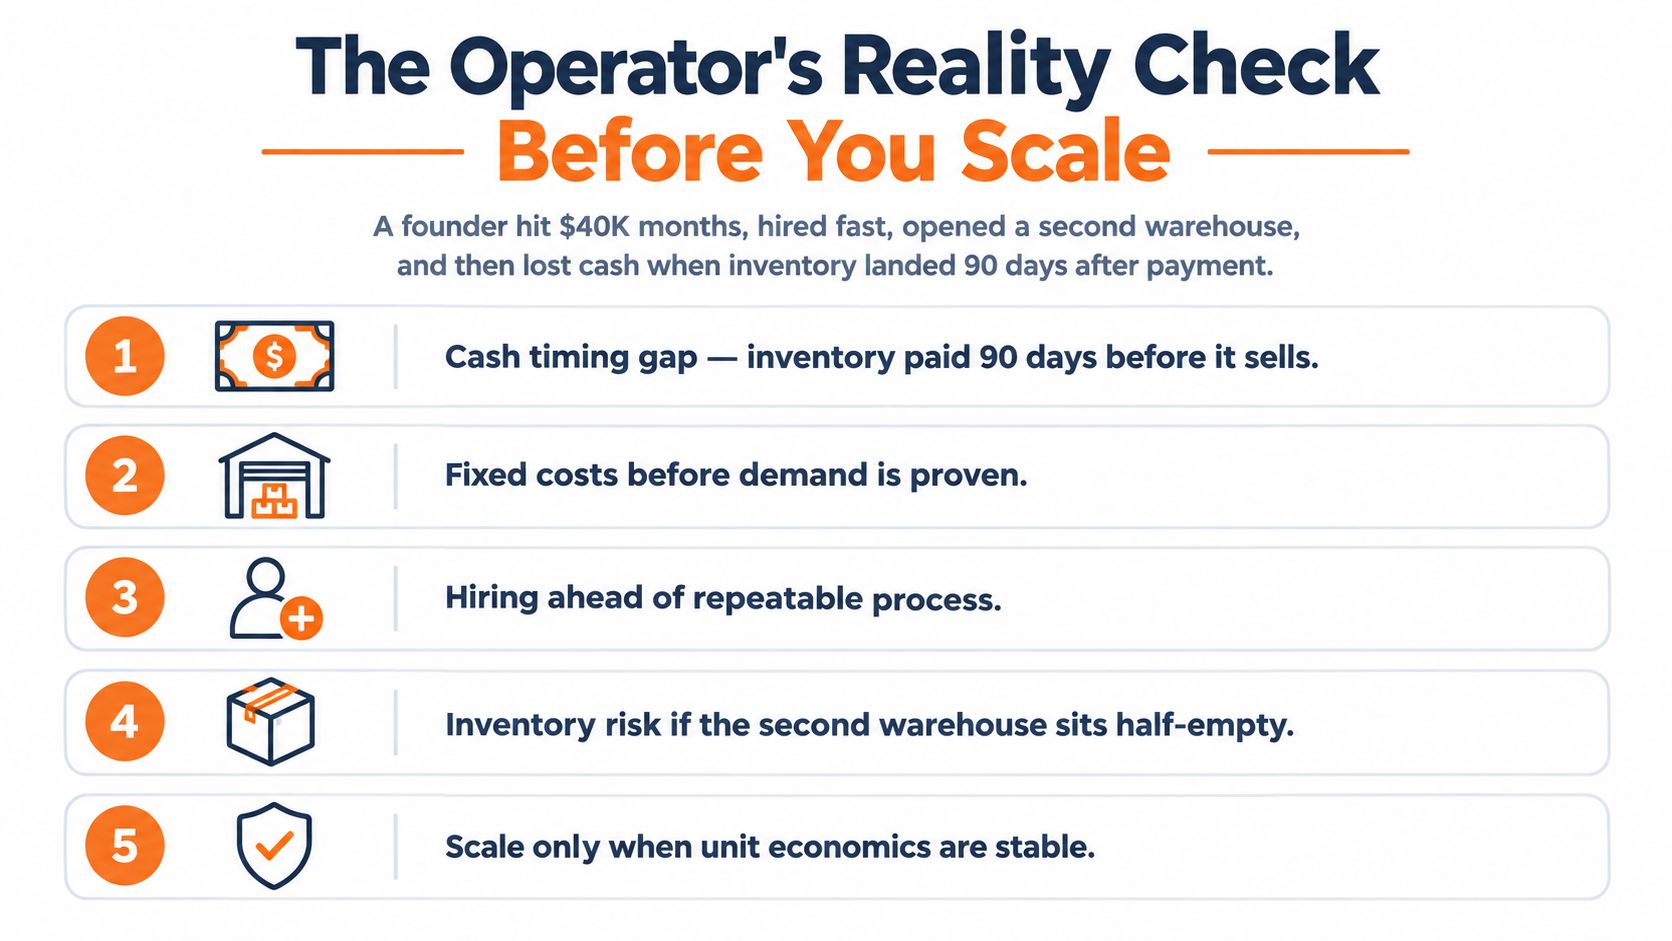
The Operator's Reality Check Before You Scale
A founder I know reached $40K months, hired quickly, and opened a second warehouse. The brand had demand. Customers liked the product. The problem appeared later, when inventory landed 90 days after payment. Cash left the business long before sales returned it. Payroll, storage, freight, and reorders kept arriving on schedule while revenue arrived in uneven waves.
The revenue chart looked healthy. The cash-conversion cycle looked dangerous.
That distinction matters across ecommerce. Worldwide ecommerce sales could reach about $6.88 trillion in 2026 and roughly $8.03 trillion by 2027, according to SOAX's ecommerce growth research. A growing category creates opportunity, but it also makes careless scaling more expensive. You can lose more money faster when you buy inventory, staff, and advertising before your economics can carry them.
Run four diagnostics before adding fuel
Contribution margin per order comes first. Subtract product cost, payment fees, pick and pack, shipping subsidies, expected refunds, returns, and variable support from the order value. Revenue without this number is decoration.
Stress-test cash runway under flat revenue. Assume sales stay where they are while inventory, payroll, advertising, and supplier payments continue. If the business needs a growth month to stay solvent, you don't have a growth engine. You have a timing risk.
Measure fulfillment cost per shipment by product, destination, and carrier. A profitable order can become a weak order after oversized packaging, residential surcharges, split shipments, and expedited replacements.
Track refund and return rate by reason, not as one blended percentage. “Wrong size,” “looked different,” “arrived late,” and “changed my mind” point to different fixes. Treating them as one number hides the leak.
Use this self-audit:
- Margin: Can you state contribution margin for your top products without opening five spreadsheets?
- Cash: Can you fund the next inventory order if revenue stays flat?
- Fulfillment: Do you know the fully loaded shipment cost?
- Returns: Can you name the largest preventable return reason?
- Process: Could someone else run reorders and customer support from documented steps?
If you can't answer two or more, fix the engine before you pour more fuel into it. A practical diagnose store growth blockers workflow can help you turn vague operational concerns into a short list of measurable constraints.
Operator rule: Scale only after each additional order leaves cash behind, survives fulfillment, and has a realistic path to repeat purchase.
Find Product-Market Fit Before You Spend Another Dollar on Ads
If your store generates less than $10K in monthly revenue, treat the business as a product-market-fit project, not a paid-media project. That doesn't mean you can't run small tests. It means you shouldn't confuse ad delivery with customer demand.
Start by choosing one ideal customer profile. A product page written for “everyone who wants better quality” usually speaks to nobody. Name the buyer, the situation, and the outcome. Then rewrite the page around the one result that person wants most.
Price against the buyer's alternative, not merely a competitor's listed price. The alternative might be doing nothing, using a worse product, hiring a service, or losing time. Add a guarantee that absorbs a fair part of the buyer's perceived risk, with terms you can afford to honor.
Read the signals that buyers give you
You need evidence from behavior, not compliments. A good product-market-fit check looks at whether customers return, talk about the product without being prompted, and join your owned audience because they want more from the brand.
| Signal | What to Measure | Passing Threshold |
|---|---|---|
| Repeat purchase | Customers who place another order | A clear repeat pattern in your customer data |
| Organic word of mouth | Unprompted referrals, tagged posts, and direct recommendations | Buyers recommend you without an incentive |
| Refund reasons | Themes in refund and return requests | Reasons cluster around expectations, not product defects |
| Customer advocacy | Net Promoter Score | Above 40 |
| Owned demand | Unprompted email opt-ins | The list grows without depending on discounts |
Use Chicago Brandstarters' product-market-fit validation resource to pressure-test the offer before you expand acquisition. Talk to buyers who purchased, buyers who considered purchasing, and buyers who returned the product. Their language should shape your headline, product proof, guarantee, and objections section.
Choose one or two acquisition channels that fit your stage. If your offer still needs explanation, publish useful content and speak directly with buyers. If people understand the offer and convert profitably, test paid traffic against a strict ceiling.
My rule is simple: until at least three signals in the table are true, don't spend above a tested, profitable paid ceiling. More traffic won't repair unclear positioning, weak product evidence, or a product that attracts the wrong customer.
Pick the Right Acquisition Channel for Your Stage
Every channel charges you in a different currency. Paid social charges you in creative output and cash volatility. SEO charges you in time. Marketplaces charge you in fees, customer ownership, and pricing control.
| Channel | Time to First Revenue | Typical Payback | Margin Impact | Best Stage |
|---|---|---|---|---|
| Paid social | Fast | Short when creative and margin work | Ad spend can compress margin quickly | Early testing and proven offers |
| SEO and content | Slow | Longer, then more durable | Usually protects margin after production cost | After the offer has clear demand |
| Marketplaces | Fast | Depends on fees and repeat behavior | Marketplace fees and ads reduce margin | Reach expansion with strict SKU economics |
Paid social gives you speed. It also exposes weak creative immediately. If your product page needs a paragraph to explain the value, your ad must do even more work. Thin margins make the channel unforgiving because each acquisition cost increase comes straight from contribution.
SEO and content take patience. In practice, many brands wait six to twelve months before search visibility compounds, so you need enough cash and useful expertise to keep publishing. The payoff is a durable library of category pages, buying guides, comparisons, and product education that can support demand without another auction every day.
Marketplaces can put your product in front of shoppers quickly, but you rent the relationship. You don't fully control the customer experience, pricing, or data. Marketplace costs can reach 15% plus ads, so calculate contribution by SKU and fulfillment method before you list the full catalog.
Sequence channels instead of collecting them
Below $10K MRR, use one paid channel plus organic content. Keep the paid channel narrow enough that you can understand the creative, audience, and payback.
Between $10K and $100K, layer SEO and email. Build owned demand while you learn which products deserve more acquisition spend. If you want a structured way to improve paid campaigns, review these PPC advertising strategies before adding another platform.
Past $100K, add a second paid channel only when the first one is profitable and creative production runs as a system. If your team still scrambles for ad concepts the night before launch, another channel will multiply the disorder.
Channel rule: Add a channel when your current process can teach you something from it, not because your competitors appear everywhere.
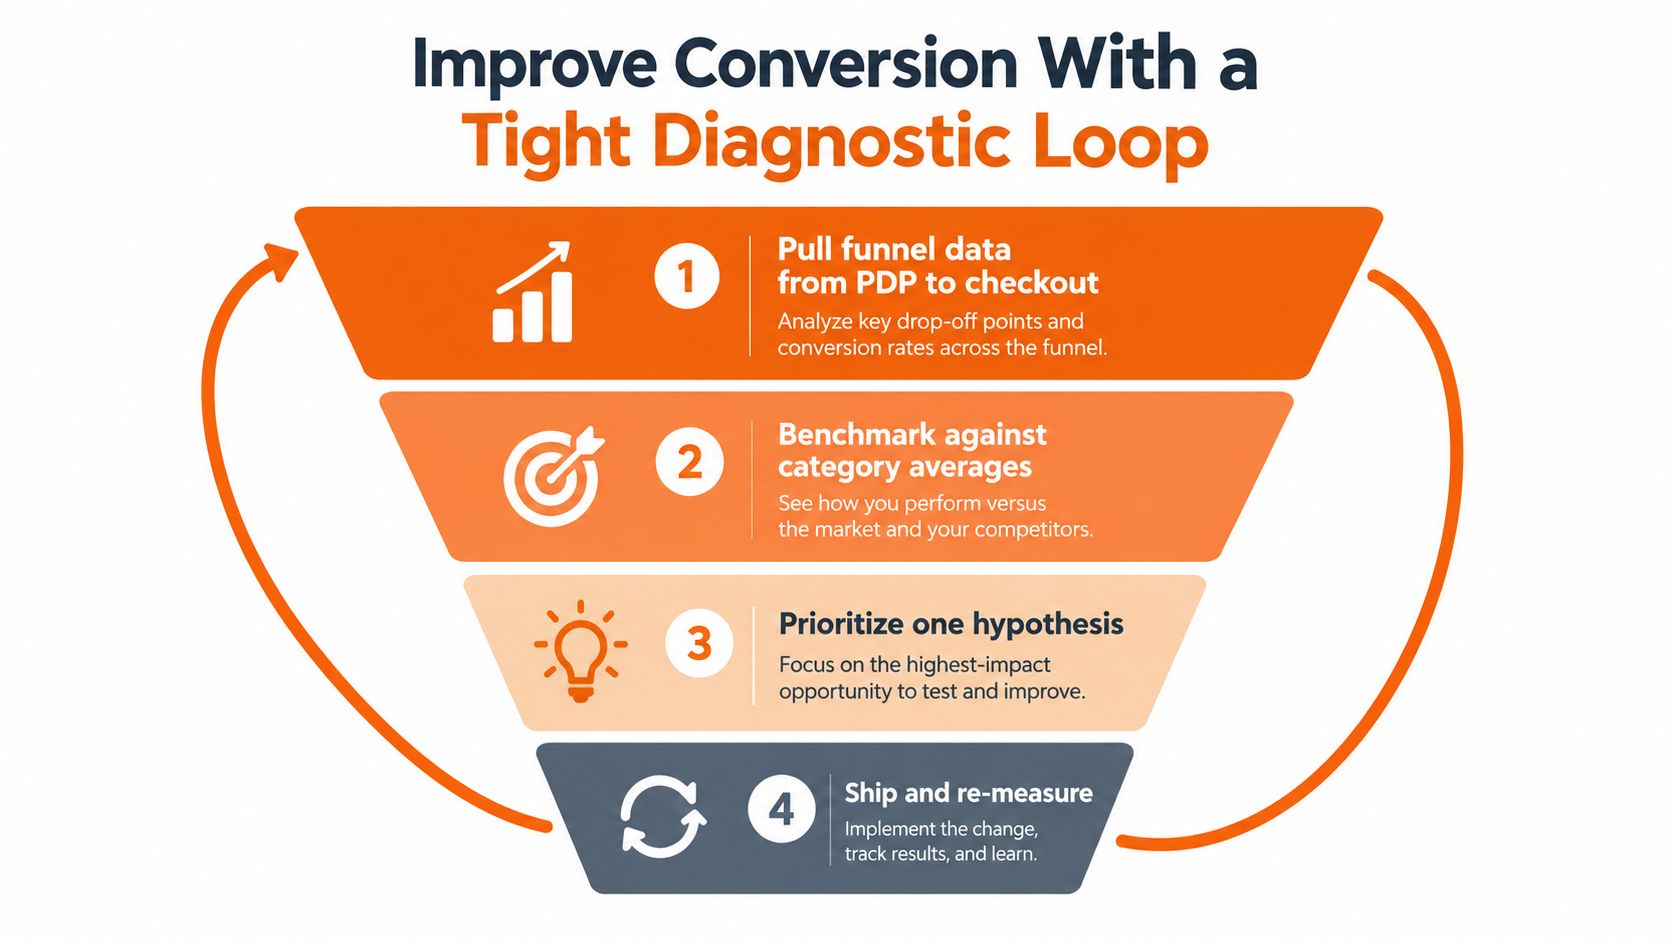
Improve Conversion With a Tight Diagnostic Loop
Traffic without conversion is expensive noise. Global ecommerce conversion benchmarks vary sharply by category and method. One 2026 benchmark placed the average at 1.4%, while a benchmark suite covering 400+ brands reported 2.66%, as summarized by Shopify's ecommerce conversion-rate guide. Use benchmarks as a starting point, then segment by device, channel, and category.
Run the same loop every two weeks:
- Pull data from product detail page view through checkout completion.
- Compare mobile and desktop, paid and organic, and each major category.
- Choose one bottleneck and write one hypothesis.
- Ship one fix and compare it with a control period or control group.
Fix the leak you can actually observe
Above-the-fold clarity: Watch recordings of new visitors landing on the product page. If they scroll before understanding what the product does, rewrite the headline, outcome, price, and primary action. Measure add-to-cart rate from the same traffic source.
Social proof placement: Compare pages where reviews appear near the buying decision with pages where reviews sit far below it. Move specific reviews, customer photos, and objection-handling proof closer to the product claim. Track add-to-cart and checkout starts.
Shipping transparency: Review exit behavior after customers discover delivery timing or cost. Put the delivery promise, cutoff, and return terms near the purchase action. Measure checkout completion and customer-service questions.
Payment choice: Check failed payments and checkout exits by device. Add the payment methods your customers already request, then measure successful payment completion.
Mobile friction: Record a mobile session from product page to purchase. Remove unnecessary fields, reduce distractions, and test sticky purchase actions. Measure completion by device.
Cart abandonment deserves its own report. About 70% of shopping carts get abandoned before completion, and you can calculate your rate as (abandoned carts ÷ carts created) × 100, according to Stripe's cart abandonment guide. Track the stage where buyers leave instead of applying a generic discount to everyone.
For a clean dashboard, focus on metrics that drive conversions, then compare each test against the same audience and traffic mix. You can also use these conversion rate optimization techniques to expand your testing backlog without redesigning the entire store.
Build Retention Math That Compounds Over Time
Acquisition gets attention because it produces a visible number. Retention pays the bills because the second order can reuse trust, product education, and part of the original acquisition work.
Start with four figures for each customer cohort:
- First-order contribution margin: What remains after product, shipping, payment, fulfillment, returns, and variable support.
- Repeat purchase rate: The share of customers who place another order during your chosen observation period.
- Repeat-order margin: Contribution from the second and later orders after their own variable costs.
- CLTV to CAC ratio: Customer lifetime value divided by customer acquisition cost.
You don't need a complicated model at first. Build a conservative cohort sheet. Separate first orders from repeat orders, calculate contribution for each, and use actual purchasing behavior rather than an optimistic lifetime assumption.
Email gives you a direct path to the second sale. Global ecommerce email returns have been reported around $36 to $42 for every $1 spent, while US ecommerce brands have been cited at up to $72 per $1, according to Ringly's ecommerce email statistics. Treat those figures as external benchmarks, not promises for your store.
Build automation around the second order
Your basic flow should include a post-purchase education sequence, a product-use or care sequence, a review request, a replenishment or complementary-product message, and a win-back flow. Add SMS only when the customer has clearly opted in and the message earns its interruption.
Automated flows deserve priority over more broadcasts. One benchmark found a 2.11% placed-order rate for automated flows compared with 0.16% for average campaigns, as reported in Shopify's email marketing statistics. The lesson is mechanical. Trigger the message from customer behavior instead of sending the same promotion to your whole list.
Here's how retention changes the model at the same revenue level:
| Metric | One-and-Done Brand | Compounding Brand |
|---|---|---|
| Revenue | $200K monthly revenue | $200K monthly revenue |
| Customer mix | Mostly first orders | Meaningful repeat-order share |
| Acquisition burden | Every month depends heavily on new buyers | Repeat buyers reduce pressure on new acquisition |
| Email role | Promotions and occasional announcements | Education, replenishment, cross-sell, and win-back |
| Operator focus | More traffic | Better second-order experience |
The table uses the same revenue so you can see the operating difference. The compounding brand has more room to reinvest because it creates revenue from existing trust. Optimize for the second sale before you worry about the tenth.
Stop Bleeding Margin on Returns and Fulfillment
Most founders wait until returns become painful before they investigate them. That's backwards. Returns, delivery exceptions, and post-purchase support shape the economics of every customer you acquire.
Average ecommerce return rates have been reported around 20.8%, and US retail returns reached $849.9 billion in 2025, according to NovaData's ecommerce statistics. Those figures make returns a profit problem, not a customer-service footnote.
A return can include outbound shipping, return postage, payment processing loss, warehouse handling, inspection, restocking, markdowns, write-offs, and support time. If a customer returns an item because the product page created the wrong expectation, you paid to acquire the order and then paid again to undo it.
| Cost Component | Typical Range | Preventable? |
|---|---|---|
| Outbound shipping | Varies by package, service, and destination | Sometimes |
| Return shipping | Varies by policy and carrier | Sometimes |
| Processing and restocking | Depends on warehouse workflow | Often |
| Discount or write-off | Depends on product condition and resale value | Often |
| Customer support time | Depends on reason and resolution path | Often |
| Replacement shipment | Depends on the resolution | Sometimes |
The table deliberately avoids invented cost ranges because your product, carrier contracts, and return policy determine the actual amounts. Pull the actual cost from your order, warehouse, and support systems.
Separate preventable from unavoidable
Group return reasons into product defect, expectation mismatch, sizing or fit, delivery problem, duplicate purchase, and buyer change of mind. Then connect each group to one intervention.
For expectation mismatch, improve photography, dimensions, comparison charts, use cases, and product copy. For sizing, add measurement guidance and customer examples. For delivery, show an honest promise at the product page and checkout. For defects, send the evidence to product and supplier teams.
Fulfillment also affects conversion and lifetime value. Review your 3PL by accuracy, processing speed, storage terms, and exception handling. Test zone skipping where order density supports it, and consider ship-from-store when local inventory can reduce distance and delivery time.
Every preventable return you eliminate costs less than the conversion-rate lift you'd need to replace its lost margin. That's why operational improvements can beat another advertising test.
Chargebacks create a separate leak. If payment disputes are rising, document delivery, customer communication, and refund handling, then review practical guidance on how to stop Shopify chargebacks before the problem spreads.
Margin rule: Fix the reason customers return before you try to acquire more customers.
Your 30-60-90 Day Growth Plan and the Metrics That Actually Matter
You don't need a giant transformation project. You need a sequence that gives each month one job.
Days 1 to 30 fix the foundations
Audit contribution margin by product and channel. Map the checkout flow on mobile and desktop. Establish a retention baseline, document return reasons, and calculate fully loaded fulfillment cost.
Your weekly review should answer:
- Which products created contribution?
- Where did checkout users leave?
- Which return reason increased?
- How much cash will the next inventory order require?
- Which customers are ready for a second purchase?
Days 31 to 60 add one growth lever
Choose one acquisition channel that matches your stage. Publish the content or build the creative system needed to learn from it. Ship three CRO tests, one at a time, with a clear hypothesis and measurement window.
Don't add a second channel because the first feels boring. Add it when you can explain the first channel's customer, payback, creative pattern, and contribution margin.
Days 61 to 90 repeat what works
Double down on the winning channel. Turn retention messages into automated flows. Document fulfillment exceptions, reorder triggers, customer-service responses, and return decisions so the business doesn't depend on memory.
| Stage | Primary KPIs | Watch Closely | Ignore For Now |
|---|---|---|---|
| Pre-$50K monthly revenue | Contribution margin, MER, repeat rate | Cash runway and return reasons | Vanity traffic totals |
| Scaling brands | Payback period, CAC by channel, inventory turn | Stockouts and supplier timing | Blended CAC without channel detail |
| Mature brands | CLTV/CAC, return rate, net cash conversion | Cohort quality and working capital | Revenue without margin context |
Use a 30-minute Monday metric review. Keep the meeting numerical and assign one owner to each issue. On Friday, run a shipping checklist covering stockouts, delayed orders, carrier exceptions, open refunds, and next-week inventory needs.
Growth costs cash, time, and focus. Inventory may require payment before customers buy. New channels need creative, landing pages, measurement, and attention. Hiring ahead of fixed operations creates another obligation before the process can support it. Hire after the work repeats, the owner is overloaded, and the handoff has documentation.
Print this checklist:
- Economics: Calculate contribution margin by product and channel.
- Cash: Run a flat-revenue runway stress test.
- Checkout: Find the largest mobile and desktop leak.
- Retention: Build the post-purchase path to the second order.
- Returns: Rank reasons and assign one preventable fix.
- Acquisition: Choose one channel that fits your stage.
- Testing: Schedule three CRO tests.
- Operations: Document reorder, fulfillment, refund, and support workflows.
- Review: Run Monday metrics and Friday shipping checks.
Chicago Brandstarters connects founders through private 6–8 person dinners every two weeks and a group chat where members discuss practical problems such as sourcing, fulfillment, margins, pricing, and customer issues. If you're building toward seven figures and want candid operator feedback on the numbers behind growth, visit Chicago Brandstarters and explore the free community.
Leave a Reply