

Maya had a product people wanted, a polished Instagram feed, and a growing ad bill. She spent $8,000 on Instagram ads before realizing she couldn't answer a simple question: where did shoppers leave?
That mistake is common. Founders celebrate traffic, clicks, and return on ad spend while carts sit unfinished and past buyers disappear. An ecommerce sales funnel gives you a sharper view. It shows how a visitor moves from discovery to product evaluation, cart creation, purchase, and another order, with a measurable event at each step.
What the Ecommerce Sales Funnel Really Is
A store can attract qualified shoppers and still lose revenue at product pages, carts, or payment. An ecommerce sales funnel makes each handoff visible. It tracks the path from a first visit through product evaluation, cart creation, checkout, purchase, and the next order. Every stage needs a measurable event, an owner, and a specific action.
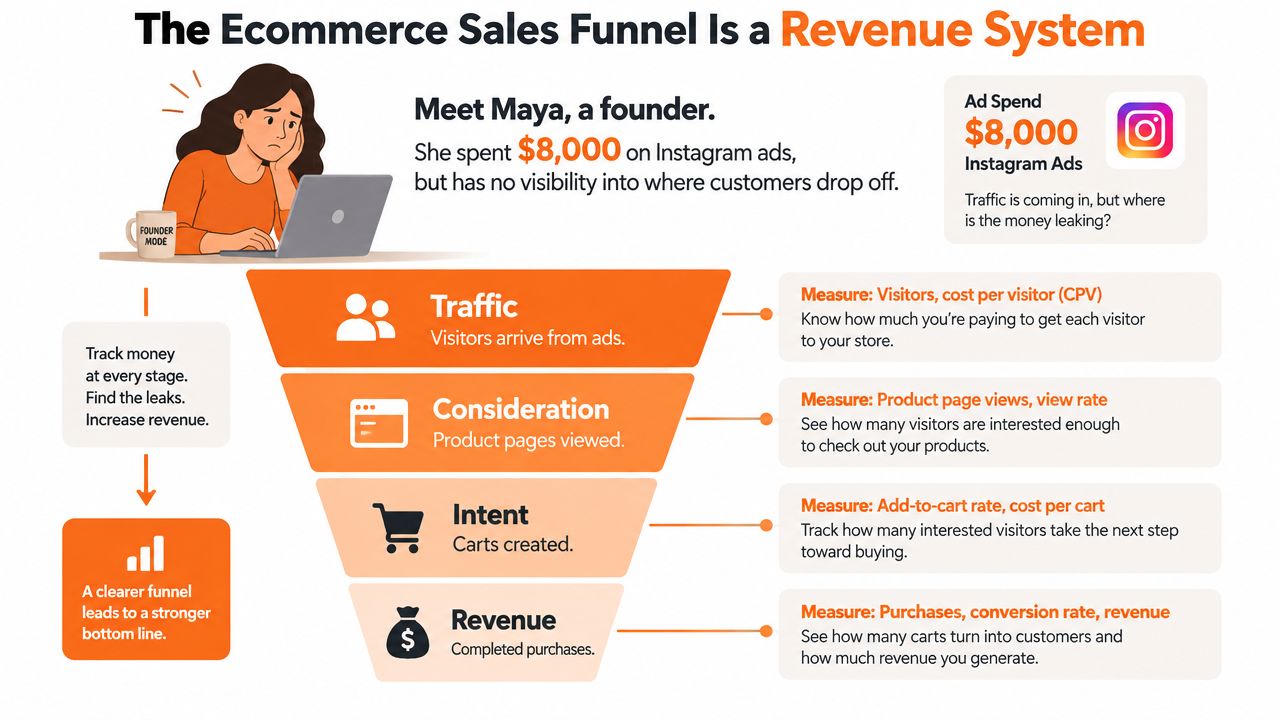
Use four operating stages:
- Awareness: people discover the brand and arrive at the store.
- Consideration: shoppers inspect products, compare options, and resolve questions.
- Conversion: buyers add items, begin checkout, and place orders.
- Retention: customers return, subscribe, refer, or purchase a complementary product.
Each stage answers a different management question. Are the right people arriving? Do shoppers understand the offer? Can ready buyers complete payment? Did the first order give them a reason to return?
Build the funnel around money
Start with events, then connect channels to them. Record sessions, product views, add-to-cart actions, checkout starts, completed orders, revenue, and repeat orders. Assign ownership at each handoff. Paid media owns traffic quality, merchandising owns product-page behavior, the ecommerce lead owns checkout, and lifecycle marketing owns repeat purchase.
A useful baseline comes from a 2026 benchmark of 168 audited A/B tests across 23 ecommerce clients. The sitewide median conversion rate was 3.5%, with a typical range of 1.8% to 5.5%. Stage medians rise with intent: 23.2% on cart pages and 34.3% during checkout, while product pages reached 4.7% and category pages 3.1%. See the ecommerce conversion rate benchmark for the full stage breakdown.
Use those figures to set priorities, not to copy a target blindly. A small improvement near payment can produce more revenue than another batch of low-intent clicks. For an approach that goes beyond traditional sales funnel advice, tie every channel decision to the stage it should improve.
Your first founder action is straightforward: instrument every stage before raising spend. Use Chicago Brandstarters' ecommerce business strategy guidance to connect funnel ownership with the broader operating plan, then review the numbers weekly.
The Four Stages from Awareness to Retention
A founder can buy plenty of traffic and still miss the sale. The ecommerce funnel becomes useful when each stage maps to a shopper action, a measurable event, and a decision you can make. In a Shopify-style store, awareness starts with a session, consideration begins with product research, conversion runs through checkout and payment, and retention starts after delivery.
Use one question at each stage:
- Awareness: Did the right people arrive?
- Consideration: Did they find enough information to continue?
- Conversion: Did intent survive the buying process?
- Retention: Did the experience earn another purchase?
Measure channels by the next action they should produce. A TikTok video may create discovery without a direct order. An email flow may produce revenue from an existing buyer without creating awareness. Give each channel a job, then judge its contribution against that job rather than forcing every source into one reporting model.
Map behavior to the right event
The table below is an operating model, not a universal benchmark. Product price, buying cycle, traffic mix, and device mix will change the numbers. Use it to identify the stage that needs an operator decision.
| Stage | Shopper Behavior | Primary Event | Founder Question |
|---|---|---|---|
| Awareness | A person encounters the brand and visits the store | Session or unique visitor | Are our messages attracting people who could buy? |
| Consideration | A shopper views products, reads details, compares options, or joins the list | Product view, add to cart, or opt-in | Does the store answer objections clearly? |
| Conversion | A shopper moves from cart to checkout and payment | Checkout start and completed order | Where does purchase intent break? |
| Retention | A customer uses the product, receives follow-up, and considers another order | Repeat purchase or reactivation | Why should this buyer return? |
A mid-sized DTC store might see roughly 25% to 35% of reach convert to product-view behavior, 8% to 12% move to add to cart, 2% to 4% reach checkout, and 1% to 3% complete a purchase. These are planning ranges from our own funnel model, not published benchmarks. Use them to spot an unusual leak, not to set targets without context. If product pages attract engagement while carts remain weak, improve the offer and product explanation before buying more traffic.
Retention requires its own time window. Track the share of buyers who return within a defined period, then compare customers by acquisition channel and product. Keep consumables separate from durable products. Their second-order timing differs, and a blended number can hide a broken customer experience. Your founder action is simple: assign a primary event to every stage, review the handoff weekly, and fix the weakest transition before increasing spend.
KPIs and Benchmarks Founders Track at Each Stage
A DTC skincare brand I worked with had a first-order problem hiding behind a ROAS target. The founder wanted cheaper acquisition, yet the store could not explain why new customers failed to reorder. We reviewed the funnel stage by stage, from the first qualified visit to the next purchase, and assigned an action to each leak.
The review found weak product-page movement, checkout leakage, and post-purchase messages arriving too late. The brand grew from $0 to $40,000 in monthly revenue by fixing those problems in sequence instead of changing every campaign at once.
Give every KPI an owner
Use the dashboard below to separate operating targets from comparison points. The ranges come from this funnel model and should guide diagnosis, not replace margin, channel, and cohort analysis.
| Stage | KPI | Target or Benchmark | Common Founder Mistake |
|---|---|---|---|
| Awareness | Sessions, unique visitors, CPM, reach, branded search lift | Compare channel volume with product-view and add-to-cart quality | Treating cheap clicks as buyer demand |
| Consideration | Add-to-cart rate | 8% to 12% | Sending more traffic to unclear product pages |
| Consideration | Email opt-in rate | 2% to 5% | Asking for an email without a useful reason |
| Conversion | Checkout completion rate | 45% to 55% | Fixing ads while payment friction remains |
| Conversion | Cart abandonment rate | 65% to 75% as a broad industry range | Accepting abandonment as unavoidable |
| Conversion | AOV and ROAS by channel | Set targets from gross margin and a 60-day payback window | Chasing ROAS while repeat rate collapses |
| Retention | Repeat purchase rate | 20% to 30% within 90 days for healthy DTC | Treating every buyer as a one-time transaction |
| Retention | LTV:CAC ratio | 3:1 target | Scaling acquisition before proving retention |
| Retention | Subscription churn and RFM movement | Improve by cohort and segment | Sending the same offer to every customer |
The 3.5% sitewide median from the benchmark cited earlier is orientation, not a promise. Product category and traffic source can move your result above or below it. Use the figure to spot an unusual gap, then judge performance against contribution margin, customer quality, and repeat behavior.
Do not let one blended conversion rate decide your budget. A channel with lower immediate ROAS may produce stronger repeat orders, while a channel with attractive first-order economics may bring customers who never return. Track acquisition source, product, cohort, and payback together.
Review weekly, then act
Assign one owner to each metric, record a target, and review the same dashboard every week. If CTR rises while product views stay flat, the ad may promise something the landing page does not deliver. If ROAS looks healthy while repeat orders fall, acquisition is masking a weak customer experience.
Export the data into a sales data analysis workflow and ask one question per review: which stage lost the most qualified shoppers, and what single change will we test next? Keep the answer tied to one owner, one event, and one decision. That discipline prevents founders from replacing a measurable funnel problem with another round of broad campaign changes.
Channel Tactics That Match Each Funnel Stage
Channels don't have equal jobs. Paid social can create demand, search can capture demand, email can recover intent, and loyalty can create another purchase. Founders waste money when they ask one channel to perform every task.
Use this rule: low-intent channels feed awareness, high-intent channels close conversion, and owned channels compound retention.
| Channel | Best Funnel Stage | Primary KPI | Budget Priority |
|---|---|---|---|
| Meta and TikTok video | Awareness | Qualified sessions and assisted orders | Fund creative testing before retargeting |
| Google Search and Shopping | Consideration and conversion | Product-view quality and completed orders | Protect high-intent queries |
| Influencer and creator partnerships | Awareness and consideration | Landing sessions, engaged views, assisted orders | Pay for audience fit, not follower count |
| SEO content | Awareness and consideration | Organic product visits and assisted conversions | Build pages around real buying questions |
| Marketplaces | Awareness and conversion | Marketplace conversion and contribution margin | Use where comparison intent is strong |
| Consideration and retention | Clicks, orders, repeat purchase rate | Build flows before frequent broadcasts | |
| SMS | Conversion and retention | Recovered carts and repeat orders | Use for timely, permission-based messages |
| Loyalty and referral | Retention | Repeat orders and referral revenue | Fund rewards from profitable behavior |
TikTok and Meta video work well when you need to introduce a problem, product, or point of view. They can burn cash when you retarget every viewer with the same product ad. Segment by behavior. Someone who watched a video needs a different message from someone who viewed a product twice and abandoned a cart.
Search operates closer to existing demand. Build separate campaigns for category terms, product terms, and branded queries. Your product page must keep the promise made in the ad, or the traffic will inflate sessions without improving carts.
Spend by the job
A $50,000 monthly brand can start with a stage-based budget model rather than a channel-first model:
- $20,000 for awareness: creative, paid social, creator tests, and discovery content.
- $12,500 for consideration: landing pages, SEO, product education, and lead capture.
- $10,000 for conversion: search, Shopping, retargeting, checkout recovery, and testing.
- $7,500 for retention: email, SMS, loyalty, referrals, and post-purchase education.
Adjust the split after you identify your largest leak. If checkout loses ready buyers, move funds from broad awareness into payment, shipping clarity, and recovery. A budget should follow the bottleneck, not protect last month's channel mix.
A Simple Funnel Tracking Template You Can Copy
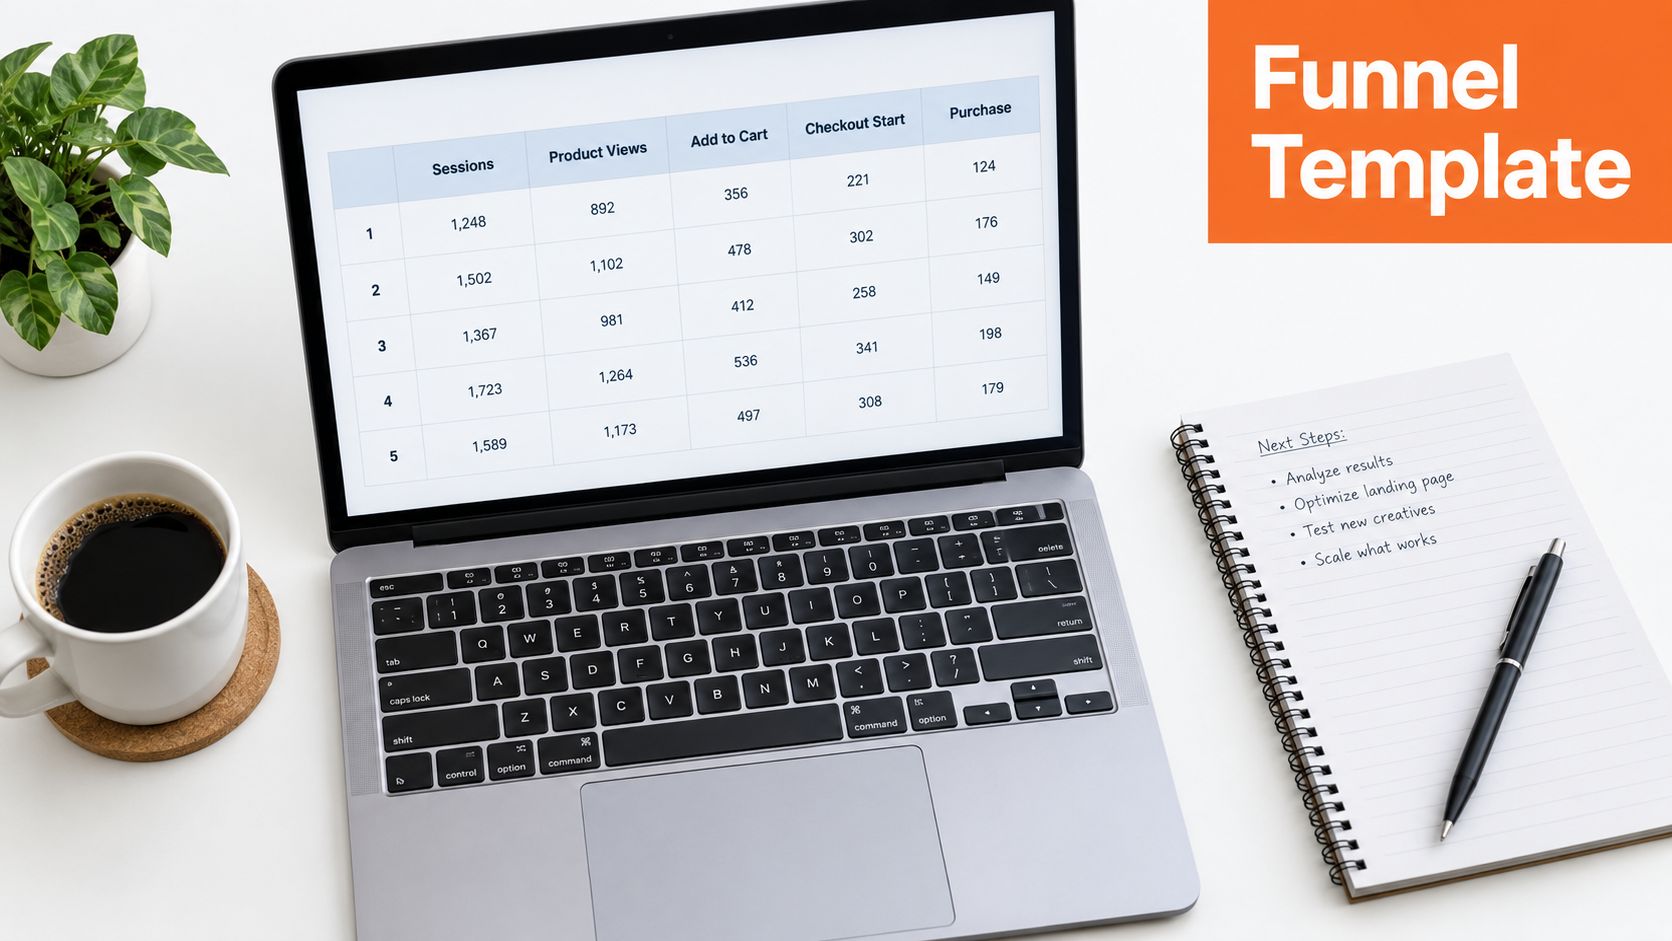
Open Google Sheets and create one row per funnel event. Keep the first version boring. A reliable sheet with five events beats an expensive dashboard nobody reviews.
Use these columns:
| Cell | Field | Example |
|---|---|---|
| A1 | Funnel event | Sessions |
| B1 | Count | 100,000 |
| C1 | Conversion from prior row | 100% |
| D1 | Drop-off from prior row | 0% |
| E1 | Revenue | Store revenue |
| F1 | Notes | Source and attribution caveats |
Create five rows:
- A2: Sessions
- A3: Product views
- A4: Add to cart
- A5: Checkout start
- A6: Purchase
Put your counts in column B. In C3, paste =B3/B2. Copy the formula down through C6. In D3, paste =1-C3, then copy it down. In F2:F6, record the source, campaign, product line, device mix, UTM status, and whether the number came from GA4 or Shopify Analytics.
Add revenue without fooling yourself
Put total revenue in E6. In E7, label the field Revenue per visitor. In F7, paste =E6/B2. This gives you revenue per session, which helps compare traffic sources with different conversion quality.
For a worked example, use 100,000 monthly sessions as a planning illustration. Enter your actual product views, carts, checkouts, purchases, and revenue from Shopify Analytics or GA4. Don't invent values to make the sheet look healthy. The template matters because it forces you to connect each event to the next event.
Pull the same fields by traffic source, campaign, and product line. Your one-page view should answer three questions:
- Which source creates the most completed orders?
- Which campaign creates carts that fail at checkout?
- Which product attracts first orders that lead to another purchase?
UTMs can disappear across devices, apps, redirects, and privacy settings. GA4 and Shopify may also use different attribution rules. Keep a notes column, compare trends under one reporting method, and avoid treating one platform's attribution as a perfect record of buyer behavior.
Where to Optimize First for the Biggest Revenue Lift
Founders often buy more traffic before fixing checkout. That order makes no sense when carts already contain products and buyers still leave.
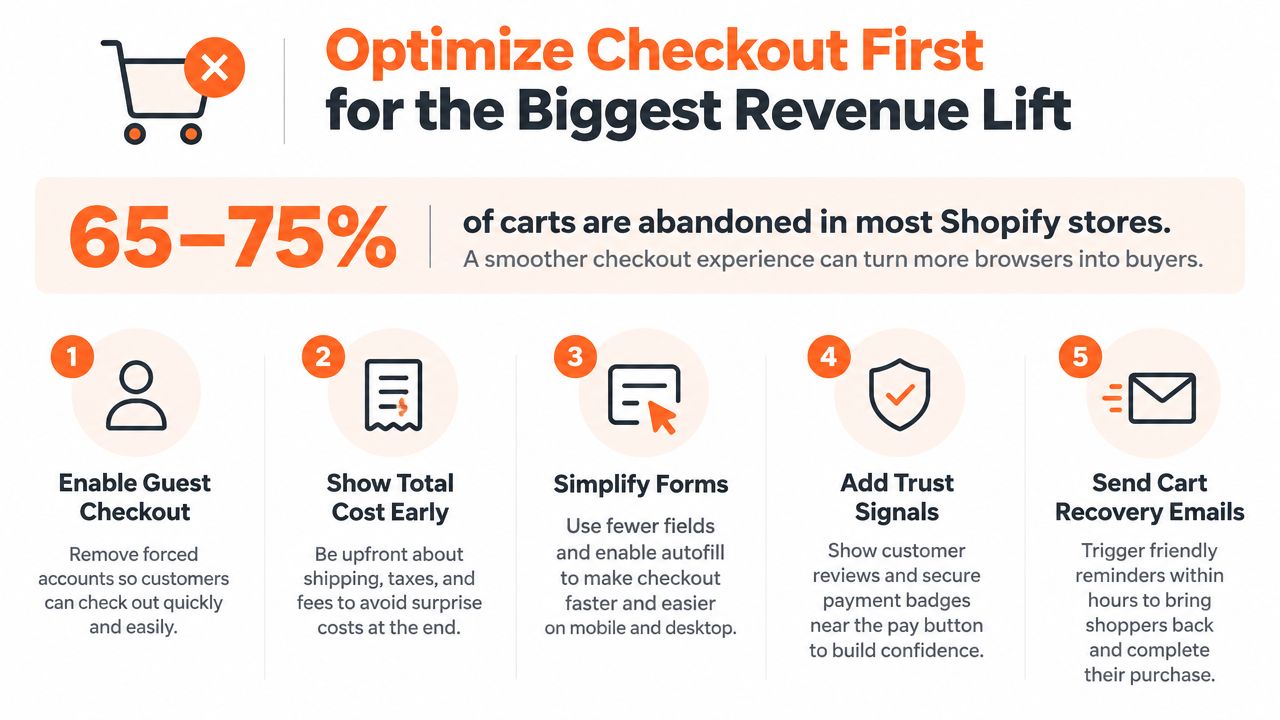
A 2026 industry summary citing Baymard data puts average cart abandonment at 70.22%, meaning only about 29.78% of carts convert. Baymard's checkout usability research also indicates that the average site could improve conversion by 35% through checkout design improvements alone. Shopify cites Baymard's testing at a more precise 35.26% conversion lift from better checkout design in a large ecommerce site, alongside the 70.22% abandonment benchmark in its checkout optimization guidance.
This is why I inspect payment before I request another creative batch.
Run a 14-day checkout audit
Day one starts on a phone, not a desktop monitor. Walk through the full purchase path as a new buyer, then repeat it with a returning customer. Record every point where the store asks for effort or creates doubt.
- Guest checkout: Remove forced account creation. Let the buyer pay first and create an account later.
- Total cost early: Show shipping, taxes, delivery timing, and discounts before the card field.
- Short forms: Remove unnecessary fields and activate address autocomplete.
- Familiar payment: Place Apple Pay, Shop Pay, PayPal, or other trusted options where buyers can see them quickly.
- Trust near payment: Put reviews, returns language, contact access, and payment reassurance beside the final action.
- Recovery timing: Send a cart reminder within hours, then use a later message with a reason to return.
The Baymard cart abandonment benchmark reports that abandonment has stayed near 70% for over a decade. That persistence points to recurring checkout friction, not a temporary traffic problem.
Test one variable at a time. Keep the offer, traffic mix, product price, and measurement window stable. Start with guest checkout or total-cost clarity, then compare completed orders and checkout completion. Don't declare a winner because one busy weekend produced a better result.
For landing-page work before checkout, use this practical guide to conversion rate tactics for landing pages. It belongs earlier in the funnel, while checkout fixes capture shoppers who already showed intent.
Watch the checkout path on mobile and desktop, then compare the recordings with support tickets. A founder should be able to name the exact friction being tested, the event it should improve, and the date when the team will review it.
Retention Plays That Turn First Buyers Into Repeat Customers
Retention is the most underpriced growth lever in many stores because founders can see ad spend immediately, while the second order arrives later. A 5% lift in repeat purchases can typically outearn a 25% traffic increase at the same margin, because the returning buyer already knows the product and doesn't require the same introduction.
The math matters, but the execution matters more. Retention starts with the buyer's next moment, not with a generic newsletter.
Match the message to the moment
Post-purchase email should begin after the order. Confirm what happens next, explain how to use the product, and ask for a review after delivery. The KPI is repeat purchase rate, with product education reducing uncertainty before the next buying decision.
Browse and cart SMS should follow consent and behavior. A browse message can answer a product question. A cart message can remind the shopper about the item, delivery terms, or available payment options. Track recovered orders, not message volume.
Loyalty and referral programs work after the buyer has experienced the product. Ask for a referral after satisfaction signals, then reward an action that creates profitable revenue. Track referral share and repeat purchase rate.
Subscriptions and bundles fit products with a natural replenishment cycle. Give customers a simple reason to choose a recurring order, and let them change, skip, or cancel without a support battle. Track churn, retained revenue, and time to the next order.
For broader practical guidance, review this resource on customer retention for ecommerce. Use it to pressure-test your post-purchase sequence, then adapt the messages to your product's actual use cycle.
Use a 30-day retention sprint
| Vertical | Repeat Purchase Rate | Days to 2nd Order | Top Retention Motion |
|---|---|---|---|
| Consumables | 20% to 30% within 90 days | Set from actual replenishment behavior | Replenishment email and subscription |
| Skincare | 20% to 30% within 90 days | Set from product usage | Education, review request, and bundle |
| Apparel | 20% to 30% within 90 days | Set from seasonal and product behavior | Cross-sell and loyalty |
| Home goods | 20% to 30% within 90 days | Set from purchase type | Complementary products and referral |
These are operating ranges for a healthy DTC comparison, not guarantees. Track each vertical and product line separately. A durable item may need a longer second-order window than a consumable, so don't punish the store with the wrong clock.
Ship three flows in thirty days:
- Welcome flow: Explain the brand, product choice, and first-use path.
- Post-delivery flow: Ask whether the product arrived, teach usage, and request a review.
- Win-back flow: Contact buyers past day 45 with a relevant product, reminder, or replenishment prompt.
Chicago Brandstarters also publishes customer retention tactics for founders building repeatable ecommerce growth systems. Use the funnel to decide what to ship first, then let customer behavior determine what stays.
Chicago Brandstarters is a free, vetted community where Chicago and Midwest founders share operator tactics through private dinners and an active group chat. Join Chicago Brandstarters to compare funnel problems with other builders, find practical feedback on your next test, and stop solving checkout and retention issues alone.
Leave a Reply