
You're getting orders, but your bank balance doesn't seem to move. Ads bring visitors, customers ask about shipping, and returns take another bite out of whatever you thought you earned. Meanwhile, you're wondering whether to add TikTok, rewrite product pages, or finally set up those post-purchase emails.
Your ecommerce digital strategy should answer a simpler question: which customer, purchase path, and delivery policy can you afford to repeat? Start with that answer. Then choose channels you can measure and operate without spreading yourself thin.
Which Channels Your Ecommerce Digital Strategy Needs
A product can win clicks and still lose money after pick, pack, delivery, and returns. Choose two channels to start: one to reach buyers and one to encourage another purchase. Set a contribution-margin limit first, then test channels against it.
Ecommerce channels compared on time, cost and fit
Treat these timelines as planning allowances for your own test, not promises of first sales.
| Channel | Main job | Time to first sales | Cost pattern | Fits best when |
|---|---|---|---|---|
| SEO | Earns organic search traffic for product and guide pages | Budget 6–12 months | Mostly content and time | You can publish buying guides and wait for results |
| Paid search | Captures buyers already searching for your product | Allow days to weeks | Pay per click | Margins cover clicks and you can test keywords fast |
| Paid social | Creates demand and retargets product viewers | Budget 2–6 weeks of testing | Pay per impression or click | You have strong visuals and a clear proposition |
| Email and SMS | Turns past buyers into repeat buyers | Start after collecting permission-based contacts | Low cost per message plus tool fees | You collect marketing consent |
| Marketplaces | Borrows existing platform traffic | Plan for days after listing approval | Commission per sale | Buyers search the platform but your site gets little traffic |
| Social commerce | Sells inside social apps | Allow 1–3 months for setup and testing | Platform fees or ad spend | Your buyers already shop on the platform |
Choose by buying behavior
For SEO, publish pages that help buyers choose: dimensions, compatibility, materials, and comparisons. Complete category pages before filling a blog with broad lifestyle posts. Use this ecommerce SEO strategy to organize the work.
With paid search, start with specific product-intent queries. Separate branded searches from searches that introduce new customers. Otherwise, existing demand can look like new customer acquisition.
Paid social suits products that are easy to demonstrate visually. Test the demonstration and purchase proposition before commissioning a large batch of polished creative.
Use email and SMS for relevant follow-up, not constant discounting. A delivery update and a replenishment reminder serve different purposes, and each requires appropriate marketing consent.
Marketplaces can put products in front of shoppers already browsing there. Compare commissions and promotional charges with the value of limited control over the customer relationship.
For social commerce, start on the platforms where your customers already shop. DHL's ecommerce trends research shows that social media is a meaningful purchase channel for many shoppers.
Choose a channel because you can reach a buyer profitably, not because you feel absent from it.
Use a digital marketing strategy for ecommerce profitability to weigh channel costs against the margin left after fulfillment and returns. For near-term sales, consider paid search or marketplaces. If cash is tight and results can take longer, consider SEO and email.
Map the Customer Journey From Click to Repeat Order
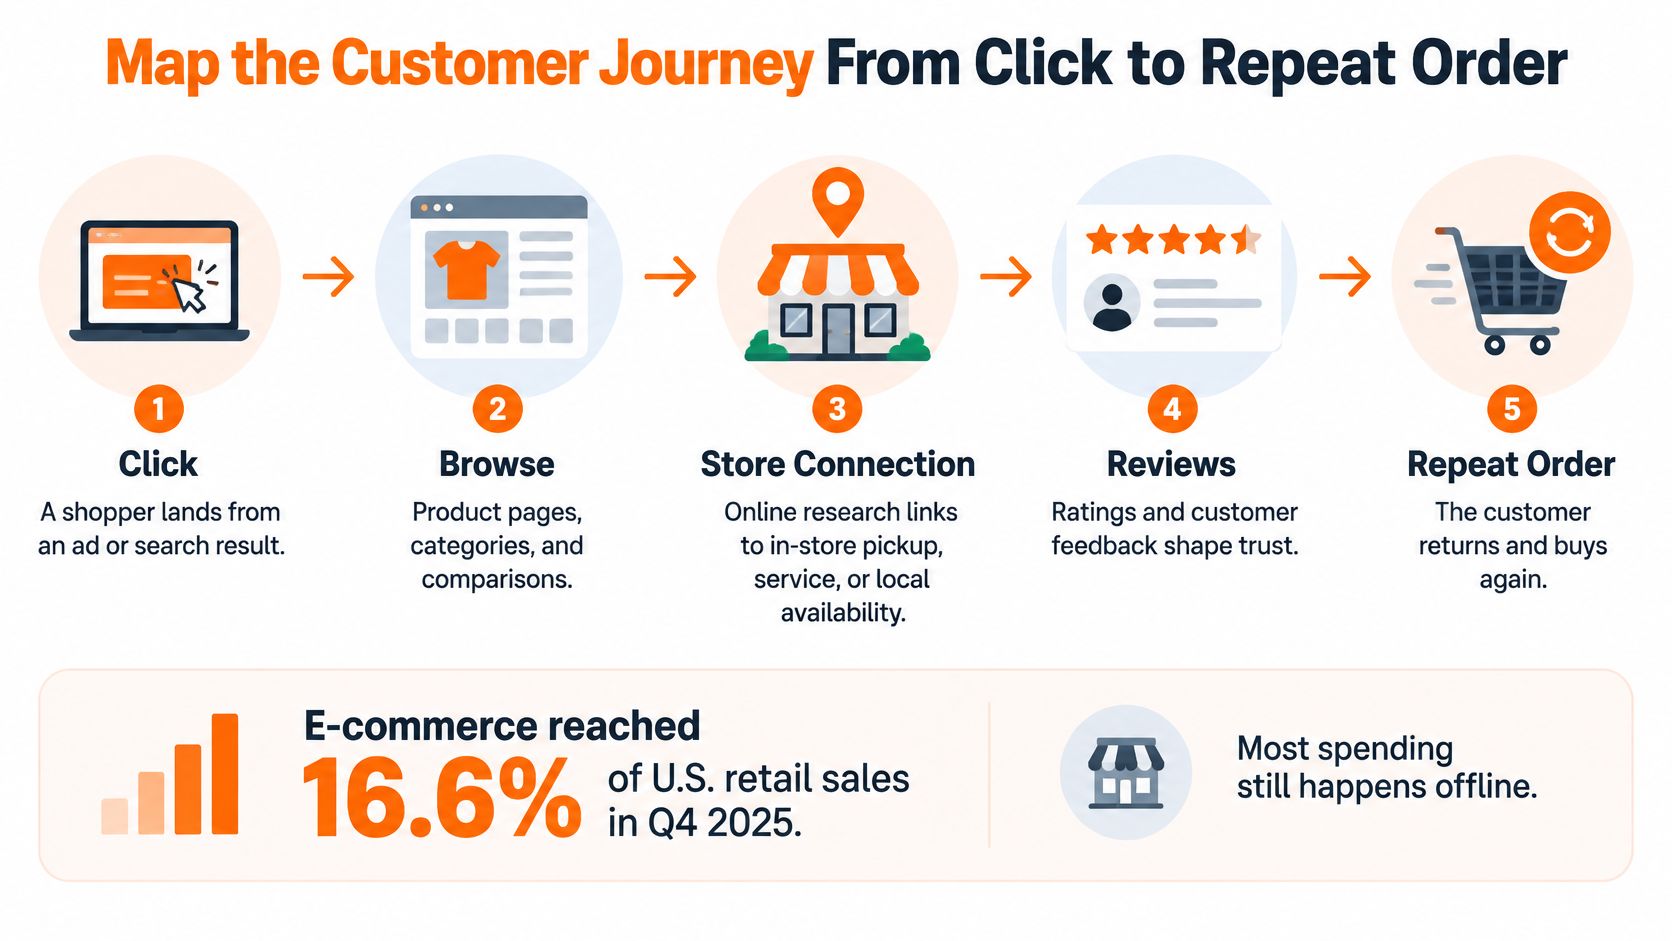
A customer who discovers a product through an ad still has to compare options, decide, complete checkout, receive the order, and choose whether to return. Map all six stages so the campaign, storefront, and delivery experience work together.
In Q4 2025, ecommerce accounted for 16.6% of U.S. retail sales, according to the U.S. Census Bureau. Connect your website to pickup availability, customer service, and the information shoppers need before visiting a store.
Give each stage an asset and an owner
- Discover. List the searches and social posts that bring first-time visitors. Match each to a category page or buying guide, and record which campaign sends shoppers there.
- Compare. Identify the pages buyers use to check price, size, and reviews. A comparison page or sizing guide can answer those questions. Send comparison-intent ads to the relevant page, not the homepage.
- Decide. Name the objection that could stop a purchase. Address unclear sizing or shipping terms on the product page. Make retargeting answer that objection without inventing urgency.
- Buy. Track the path from add-to-cart to confirmation. Treat the cart and checkout as part of the customer experience, and retain campaign identifiers through payment to connect purchases with acquisition.
- Receive. Record actual delivery time and the first support question. Keep the tracking page and support email consistent with the order experience. Delivery problems can affect whether a first purchase becomes a repeat order.
- Return. Give customers a relevant reason to reorder. Use an account page or replenishment email, and run paid campaigns to existing customers only when the economics work. For a hypothetical consumable, test a reminder 30–60 days after delivery against expected usage.
A local-pickup customer needs different instructions from someone waiting for a parcel. Use YipSMS Inc.’s guide to segment shoppers for multichannel campaigns to plan for those different paths.
Use the accompanying video to review the journey with whoever manages your storefront and campaigns.
Finish with a one-page map. For every stage, record the responsible person, the customer's question, and the point where the customer may leave. Fix the stage losing the most qualified buyers first.
Measurement and Attribution Without Guesswork
A campaign can report revenue while losing money on shipping, returns, and fees. Start with contribution margin per order so channel reports sit alongside the cost of serving each customer.
Core ecommerce metrics and their formulas
| Metric | Formula | Question it answers | Check when |
|---|---|---|---|
| Conversion rate | Orders divided by sessions | Are visits turning into sales? | Weekly |
| Average order value | Revenue divided by orders | Are baskets growing? | Weekly |
| Customer acquisition cost | Ad spend divided by new customers | What does each new buyer cost? | Weekly |
| Repeat purchase rate | Customers with two or more orders divided by all customers | Do buyers come back? | Monthly |
| Contribution margin per order | Revenue minus product, shipping, returns, fees and ad cost, calculated per order | Does each order make money? | Monthly |
| Payback period | Months until gross margin covers acquisition cost | How long does cash stay tied up? | Monthly |
Use net revenue consistently. Don't subtract refunded revenue twice when calculating returns costs. Track return labels, inspection, and inventory losses as separate costs. For repeat purchases, compare customer groups with similar time to reorder.
Separate credit from causation
Use last-click attribution for a quick operating view, then add first-touch columns for search and social to see where discovery began. Neither model proves that an ad caused an order.
Compare purchase events in analytics with completed store orders before relying on channel reports. The Google Analytics guide for beginners can help you set up reporting. Before changing tracking architecture, read How enhanced conversions differ from server-side tracking. The two approaches are not interchangeable.
Test a measurable change
Google's Milliseconds Make Millions study reported that a 0.1-second improvement in mobile load time was associated with 8% higher retail conversions and 10% higher travel conversions. Those findings give you a reason to test speed, not a forecast for your store.
Run a controlled experiment:
- Establish a baseline. Record mobile conversion, load metrics, and revenue per session over a proposed four-week observation period.
- Change a template. Aim to remove 0.1 seconds without changing pricing, copy, or promotions.
- Keep a holdout. Randomly assign eligible sessions to the old or new version, and keep each visitor's assignment consistent.
- Judge purchases. Compare completed orders and revenue per session, accounting for sample size and campaign changes.
Check acquisition cost and conversion weekly. Review repeat rate and margin monthly, allowing enough time for returns to appear.
Acquisition and Retention Playbooks Compared
Acquisition wins the first order. Retention earns the next ones. Fund both, but give each a different job and judge each against the behavior you want.
| Playbook | Actions | Measure | Review rhythm |
|---|---|---|---|
| Acquisition | Run paid search, paid social, and marketplace listings | New-customer acquisition cost | Weekly |
| Retention | Build welcome, post-purchase, and reorder messages | Repeat purchase rate by customer group | Monthly |
| Win-back | Contact lapsed buyers with a fresh reason to return | Incremental profitable reorders | After each test |
| Referral | Ask for honest feedback and reward qualifying referrals | Share of orders from referrals | Monthly |
Acquisition messages should explain why a new buyer should choose you. Retention messages should recognize what the customer already owns. Don't send a first-purchase discount to someone who just bought at full price.
For win-back, you might test messages at 90 and 180 days in a hypothetical campaign. Give each a different reason to return: a useful accessory, a restock, or a product improvement. Don't keep repeating the same coupon.
Work through the candle example
Say a candle brand spends $2,000 per month on paid social and gains 80 new buyers. Its hypothetical acquisition cost equals $25 per buyer. That number alone doesn't tell you whether the campaign earns money.
Suppose three in ten of those buyers return. You gain revenue beyond their first purchases, but you still need to subtract repeat-order costs and email expenses before increasing your acquisition budget. Move money into email when you can demonstrate incremental profitable orders, not merely because email claims credit for returning customers.
Budget warning: If acquisition cost rises while repeat purchasing stays flat, pause expansion and inspect the product proposition before buying more traffic.
Keep reviews separate from referral rewards
Ask every buyer for honest feedback, including unhappy customers. Reward referrals for qualifying purchases, and never make a review incentive depend on a favorable rating.
The FTC's Consumer Reviews and Testimonials Rule, effective October 21, 2024, prohibits fake reviews and incentives conditioned on a particular sentiment. Disclose incentives and material relationships, and check platform policies before rewarding review participation.
At publication, the Federal Register rule document stated a maximum civil penalty of $51,744 per violation, subject to statutory factors and possible lower court-imposed amounts. Don't treat that historical amount as a current penalty quote.
Fix Checkout Leaks Before You Buy More Traffic
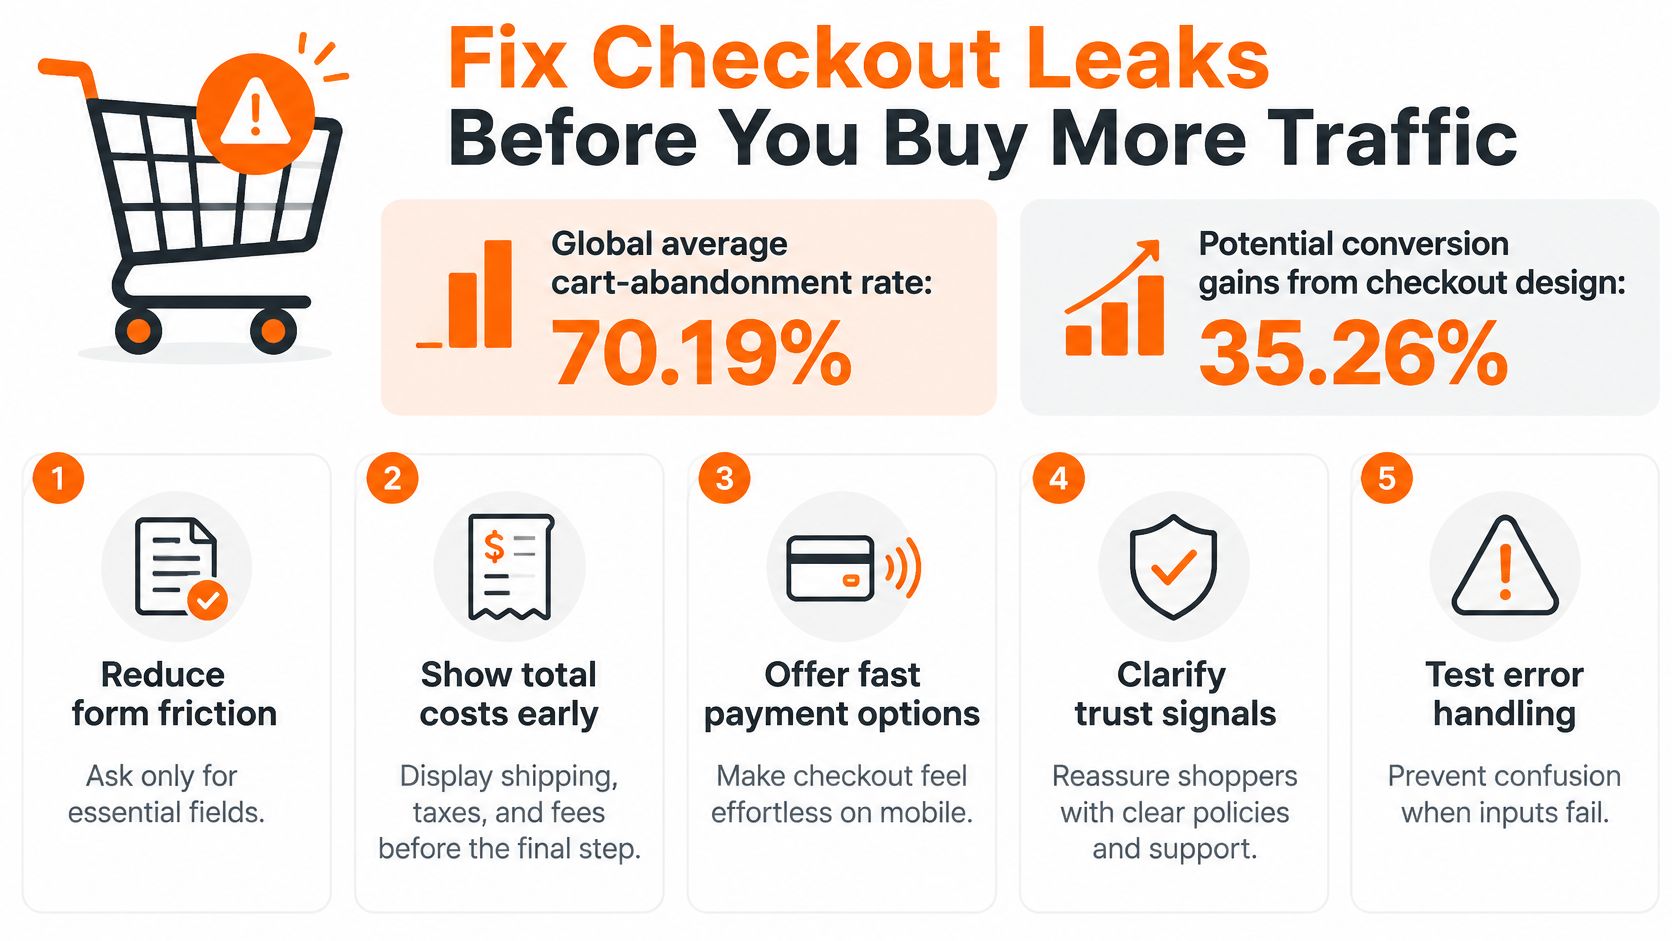
A shopper can reach payment and still abandon the order because a field is confusing, a payment method fails, or the full cost appears too late. Baymard reports a 70.19% global average cart-abandonment rate and finds payment-option problems on 21% of sites in its checkout-usability overview. Use those figures as prompts to inspect your own checkout, not as a forecast.
Place test orders on a phone and desktop. Record where the purchase path breaks.
Audit the purchase path
- Count visible form elements. Include optional fields, coupon boxes, repeated addresses, and account prompts. Baymard's cart-abandonment analysis reports an average U.S. checkout with 23.48 elements, compared with an ideal of approximately 12–14. Remove requests you don't need to fulfill the order.
- Test the payment list. Complete transactions using the methods your customers expect. Check authorization failures, wallet handoffs, and the return to order confirmation. A visible payment logo doesn't prove the integration works.
- Find guest checkout. Make it apparent before asking shoppers to create an account. Invite account creation after purchase instead of making it a condition of buying.
- Show the total early. Display shipping, tax, and applicable fees before payment. If you need an address to calculate the total, explain why and provide an estimate where practical.
- Test invalid entries. Enter a bad postcode, an invalid card, and an incomplete address. Check that each error identifies the problem and preserves the rest of the form.
Score each item fixed, partly fixed, or broken. Record a screenshot, device, reproduction steps, and owner. Fix a broken payment method before polishing the progress bar.
Test completion rather than activity
Change one material element per experiment. Measure completed orders alongside authorization failures and support contacts, then compare results by device.
A larger checkout button can attract more clicks without producing more purchases. Keep the version that helps qualified shoppers complete their orders, not the one that makes the analytics chart busier.
Delivery and Returns Rules Before You Scale Paid Acquisition
Free shipping and free returns aren't safe defaults. You may gain orders while paying away the margin you need to fulfill them. Decide what you can subsidize before increasing acquisition spend.
Use your policy document alongside the actual carrier invoices.

DHL's 2025 shopper report found that 92% of shoppers return no more than 30% of online purchases. That shopper-level finding doesn't tell you your product category's return rate. Build your policy around your own reasons for returns and recovery costs.
Build the decision model
Enter contribution margin after shipping, return rate by category, the share of returned products you can resell, and orders by delivery zone. Include packaging, pick-and-pack charges, return inspection, and replacement shipments.
Delivery and returns options compared
| Option | Best for | Main margin risk |
|---|---|---|
| Paid expedited delivery | Urgent buyers | You charge less than the fast parcel costs |
| Threshold free shipping | Small baskets | You set the threshold too low |
| Exchanges before refunds | Sizing-driven returns | You add handling without preventing a refund |
| Store credit | Keeping cash in the business | You retain a redemption obligation |
| Local pickup | Stores or partner shops | You incur staffing and storage costs |
| Parcel-locker returns | Dense city zones | You pay locker fees on each return |
Choose practical alternatives:
- Charge for urgency. Price expedited delivery against the actual service cost.
- Test a threshold. Start just above average order value, then check whether added basket margin covers shipping.
- Suggest exchanges. Make replacement sizing easy without obstructing legitimate refunds.
- Give a credit choice. Keep terms clear and don't mistake retained cash for completed profit.
- Arrange pickup. Confirm opening hours, handoff responsibility, and collection reminders.
- Assess lockers. Compare customer convenience with fees and the return journey.
For Midwest founders, test distant and low-density routes explicitly rather than copying a coastal brand's policy. Use this ecommerce logistics guide to organize fulfillment decisions.
Stress-test the policy before you promise it to every customer.
For each product line, model a hypothetical 25% return rate. Would you still earn money after recovery, restocking, and acquisition costs?
Set Your Budget Split and Launch the First 90 Days
Use the following proposed budget allocation, not an industry benchmark. Split your marketing budget among acquisition, retention, and a protected testing reserve.
Budget split by growth stage
| Stage | Revenue range | Acquisition | Retention | Tests |
|---|---|---|---|---|
| Launch | Pre-revenue to first sales | 60% | 20% | 20% |
| Traction | Recurring sales with stable repeat purchasing | 55% | 30% | 15% |
| Scale | Sustained revenue with positive contribution margin | 45% | 40% | 15% |
Use the launch allocation when you lack repeat-purchase evidence. As a proposed operating rule, move to traction after repeat purchasing holds steady for two months. Move toward the scale allocation when per-order margin and customer behavior justify more retention work.
Don't graduate stages because you hit an arbitrary revenue milestone. A high-revenue store with expensive returns may have less room to invest than a smaller store with dependable repeat orders.
Give the launch a decision schedule
- Days 1–30. Launch a focused test. Choose your channel pair and use a single purchase proposition. Confirm inventory, delivery promises, and purchase tracking before increasing spend. Record what would make you continue, revise, or stop each campaign.
- Days 31–60. Build the follow-up and remove friction. Set up welcome and post-purchase emails with useful product instructions. Fix the largest checkout problem from your audit. Keep a change log so you can distinguish campaign changes from storefront changes.
- Days 61–90. Make the margin decision. Review contribution per order by channel and product line after allowing for returns. Cut channels that lose money without a credible, funded path to payback. Don't preserve a campaign because you like its creative.
Protect cash while you learn
Keep the testing reserve separate from routine spending. Write a hypothesis before using it: what you'll change, which customers qualify, what you'll measure, and what result would justify continuing.
You don't need to automate every decision. Export orders, advertising costs, and return expenses into a spreadsheet if that gives you a clearer answer than another dashboard subscription.
As members reach seven figures, we encourage them to apply to EcomFuel and Million Dollar Sellers. Your operating plan should change as your business grows, rather than preserve launch habits indefinitely.
This week, write your channel plan, assign responsibility for each task, and book your day-30 review. Put the contribution-margin worksheet beside the campaign report so you make the spending decision with both open.
We built Chicago Brandstarters for kind, bold, hard-working Chicagoans and Midwesterners who are starting brands. Bring your channel choices, delivery trade-offs, and margin questions into a community where founders share practical tactics and honest support. Visit Chicago Brandstarters to learn about the community and apply to join.
Leave a Reply