

You have a product idea, a half-built Shopify theme, and a spreadsheet that says you'll be profitable by month six. That spreadsheet never asks when the supplier wants a deposit, or what a returned order does to the cash you already spent on ads and freight. I would not put another dollar into inventory or ads until those two questions have dates and dollars attached.
An ecommerce business plan is where you force the answers. I treat every section as a test. Can you name the day cash leaves? After shipping, fees, and returns, does the order still pay you? If either answer is fuzzy, the revenue chart is a wish.
The Eight Parts of an Ecommerce Business Plan
| Part | Question it answers | What to include |
|---|---|---|
| Executive summary | What the business is and why it should work | One-page summary of the offer, first-year target and funding need, written last |
| Company and product | What you sell and why it stands out | Product list, price tiers, sourcing and brand story |
| Market analysis | Who buys and how big the segment is | Segment definition, market size calculation and competitor pricing |
| Marketing and sales | How customers find you and buy | Channels, cost per order and conversion assumptions |
| Operations and fulfillment | How orders ship and returns get handled | Supplier terms, warehouse or 3PL choice, carrier rates and return policy |
| Team and roles | Who does the work and what it costs | Founders, contractors, tools and their monthly cost |
| Financial plan | Whether the numbers work and when cash runs out | Five-year statements, monthly year-one forecast and break-even |
| Growth plan | What happens next and what the next stage needs | Channel expansion, retention targets, funding need and decision triggers |
Think of the plan as a trail map with checkpoints, not a weather forecast. A forecast guesses next month's rain. A map tells you which fork you take when the trail splits, and which number you check before you keep walking. Every part above has to end in a number you can test against a real order.
Write the parts that feed the others first
A shop plan can lean on foot traffic and a lease. Your storefront is a website. The work that decides profit happens in a warehouse, with a carrier, and in the returns bin. That is why operations carries more weight than most founders give it. If you sell printed goods, sourcing and print method belong in the product part before you price anything. A practical walk-through of how to start a DTF business shows how transfer printing, blanks, and equipment choices change unit cost before you write a single ad assumption.
When time is short, I write market size and cash timing first. Marketing spend, break-even, and the growth plan all borrow from those two. The executive summary comes last, because it can only summarize numbers you have already built. Write one page for each part before you add detail. The blank lines are the gaps. Fill those before you polish sentences.
Size Your Market With Numbers You Can Check
A running-sock brand targeting women aged 25 to 40 in the Midwest can start with a reachable segment, then test whether that segment can support a real sales target. A national ecommerce total provides context; it does not forecast your orders.
- Name the buyer. Define one customer, one need, and one region. “Everyone who runs” is too broad to estimate.
- Count people you can reach. Use search demand or an addressable platform audience. For this example, assume a working count of 40,000.
- Estimate purchase frequency. Start with 1.5 orders per year for a product customers may reorder.
- Multiply by average order value. At $48, the segment represents 40,000 × 1.5 × $48, or $2.88 million in annual sales.
- Apply a testable capture rate. At 2% in year one, projected sales are $57,600, not $2.88 million.
Treat the $57,600 as a sales target to test, not cash you can spend. If you cannot explain how you counted the 40,000 potential buyers, the estimate is not ready to support inventory or marketing commitments.

Use the national total only after your own math
The U.S. Census Bureau's fourth-quarter 2025 ecommerce release estimated seasonally adjusted retail ecommerce sales at $316.1 billion, up 1.7% from the third quarter and 5.3% from the fourth quarter of 2024. Ecommerce accounted for 16.6% of total retail sales that quarter. Total retail sales were about $1.90 trillion, up 2.7% year over year. For full-year 2025, Census reported retail ecommerce sales of $1.2337 trillion, up 5.4% from 2024, and equal to 16.4% of total retail sales.
These are nominal sales figures, adjusted for season but not price changes. Dollar growth does not establish unit growth. Check whether higher prices, more orders, or both explain the market trend before using it to support your forecast.
Practical rule: Estimate the segment that a small outreach or ad test can reach. Then check whether local prices, repeat purchases, and contribution margin can support expanding beyond it.
Pair the national context with local buyer counts, competitor prices, and a budget small enough to test. Use market research methods for estimating reachable demand to connect search demand and customer counts to a capture rate you can measure.
Cost Fulfillment Before You Buy Inventory
A buyer adds a $48 item, sees free shipping, and checks out. Freight, duties, the outbound zone, and a return can erase the contribution margin on that order before you wire a deposit for the first production run. Price and shipping decide whether someone checks out. What you keep is landed cost minus the subsidy you paid so the cart said "free."
In a 2025 Ryder survey of 1,376 U.S. online shoppers, 76% named free shipping as a purchase motivator for the 2025 holiday season, according to the Ryder 2025 ecommerce study. In a 2025 Ipsos survey of 3,000 online shoppers across the United States, United Kingdom, Germany, France, Spain, and Mexico, 68% named price as an important factor, per Ipsos research on what online shoppers value. Shoppers want a low price and free shipping. The plan has to name who pays for that, and whether one order still clears a contribution margin after the label and a return.
Cost one order before the production run
- Pick the ship-from point. Your spare room, a 3PL, or a marketplace warehouse. Write the monthly fee even if this month's volume is zero.
- Build landed cost. Product, inbound freight, duties, and the mailer. If the mailer is an afterthought, your margin is fiction.
- Add the outbound rate by zone, plus any subsidy you pay so the buyer sees "free."
- Set a return rate and the cost to ship back, inspect, and restock or scrap.
- Write supplier terms in days and put each payment on a cash calendar, so cash leaves before the sale is in the forecast.
- Move every amount into variable cost per order.
Run one Chicago or Midwest test to a nearby ZIP and a far ZIP. Zone gaps show up on a $12 label long before they show up in a yearly forecast. A yearly total cannot prove a zone you have not priced. If free shipping on a $48 order eats the unit margin, raise the free-shipping threshold or switch carriers before the first production run. I would rather lose a few checkouts than lock in a product you cannot afford to ship. Compare 3PL fees and carrier zones on that same one-order math before you buy the first carton.
Model Cash Timing Before You Count Profit
Profit is the water level in a lake. Cash is the water moving through the pipes. A stock purchase opens the valve weeks before a sale brings water back. You can watch the lake look full on an income statement while the pipes run dry.
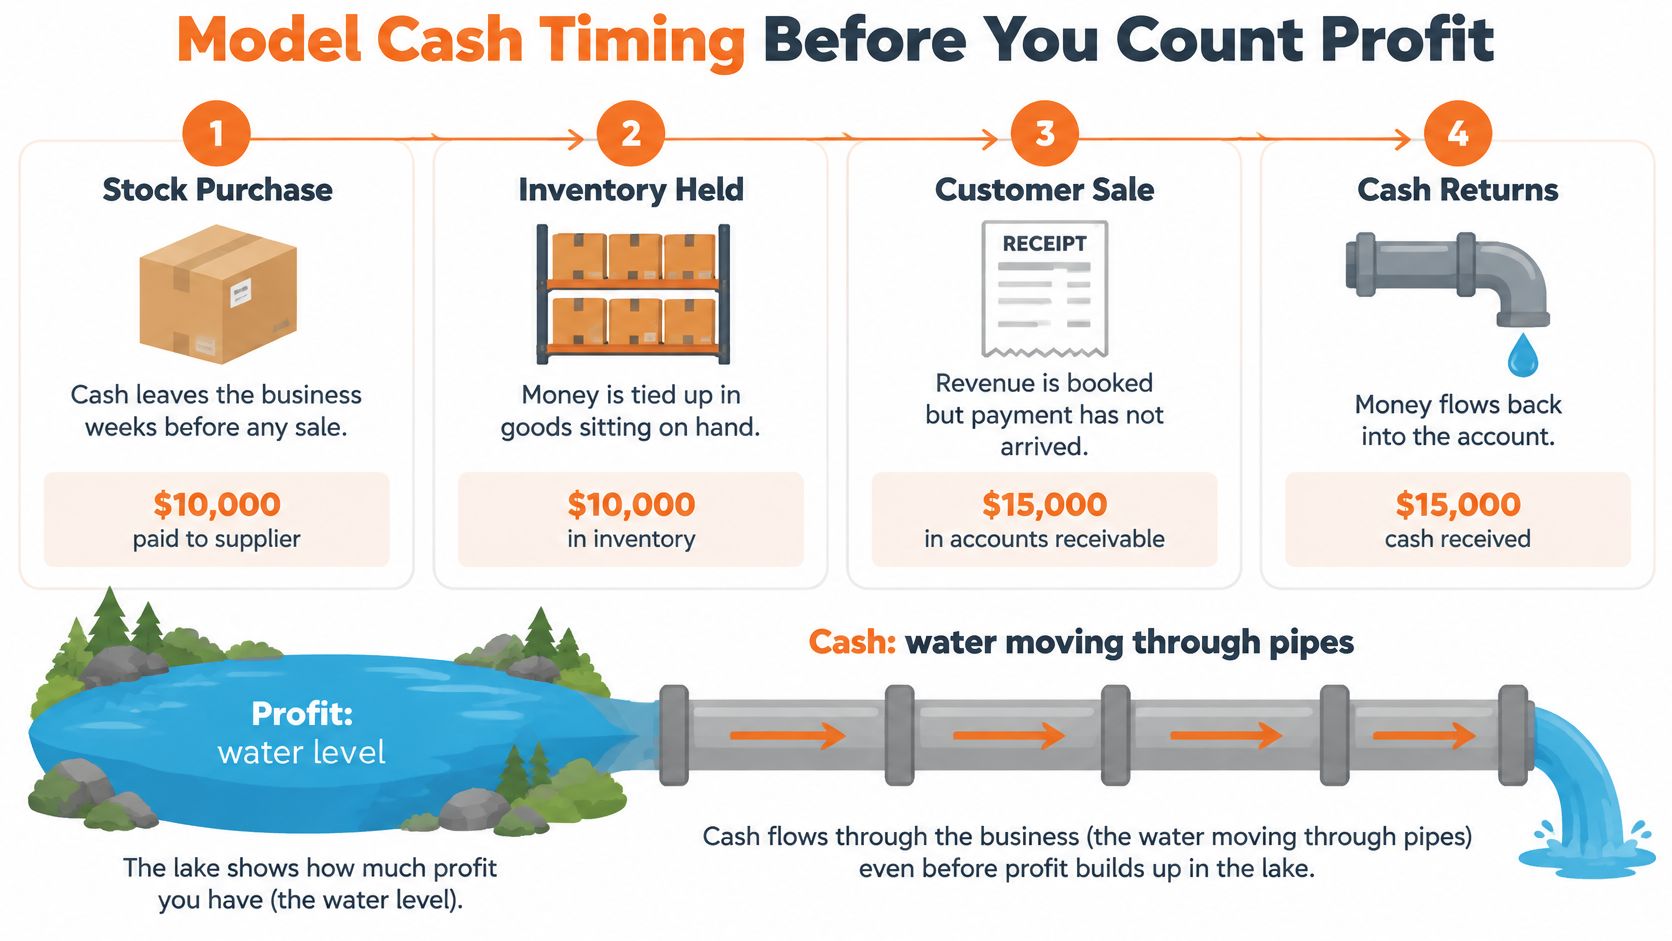
| Cash event | Typical timing | Plan line |
|---|---|---|
| Supplier deposit | 60 to 90 days before the sale, when you place the order | Inventory purchases |
| Supplier balance | Before the goods ship, often weeks before revenue | Inventory purchases |
| Freight and duties | Before the goods arrive | Landed cost of inventory |
| Ad spend | Daily, often before any sale | Marketing |
| Customer payment | At checkout | Revenue |
| Processor or marketplace payout | Days after the sale, per the payout schedule | Cash receipts |
| Refunds and chargebacks | Weeks after the sale | Returns and refunds |
Planning notes on cash gaps, including supplier payments made 60–90 days before sales, also flag return rates of roughly 20–30% in some ecommerce categories, which reverse revenue after you have already paid to fulfill and advertise, as described in this ecommerce business plan template. Record the inventory purchase when cash leaves, not when the SKU sells.
Build the 18 to 24 month cash model
List every payment and receipt by date for 18 to 24 months. Add processor and marketplace payout delays on the schedule your account uses, not a same-day fantasy. Put refunds in the month they hit, not in the month of the original sale. Set a minimum cash balance and a cushion for stock that sits.
Slowing growth can be the safer plan when each extra sale needs more working capital than you can fund.
Watch for a month where cash drops under your minimum while the profit line stays positive. That month is the warning. Find it in your own model before you pick a launch budget. If the low point lands before your first reorder, you don't have a growth problem. You have a timing problem, and no ad account will fix it.
Set Break-Even Volume and Margin Targets
The SBA startup cost guide treats selling price per unit and projected unit sales as the two inputs for break-even. The formula is simple.
Break-even units = fixed costs ÷ (price per unit − variable cost per unit).
A product at $50, variable cost of $30, and monthly fixed costs of $10,000 needs 500 units a month. Unit margin is $20. Ten thousand divided by twenty is five hundred. I keep that base case on one line so every later change has something to bump against.
| Scenario | Price per unit | Variable cost per unit | Fixed costs per month | Break-even units per month |
|---|---|---|---|---|
| Base case | $50 | $30 | $10,000 | 500 |
| Higher shipping and returns | $50 | $36 | $10,000 | 714 |
| Higher ad retainer | $50 | $30 | $12,000 | 600 |
| Discount to $45 | $45 | $30 | $10,000 | 667 |
Why each row moves the answer
Variable costs rise with each order: manufacturing, packaging, payment processing, picking, shipping subsidies, and expected returns. Fixed costs sit there anyway: software, rent, salaries, insurance, and a base agency retainer.
Shipping and returns that add $6 per order cut unit margin from $20 to $14. Break-even jumps from 500 to 714. A $2,000 monthly ad retainer lifts fixed costs to $12,000 and break-even to 600, even if every order still costs $30 to fulfill.
The discount trap is worse than it looks. Cutting price from $50 to $45 drops unit margin from $20 to $15. You now need about 667 units, roughly a third more sales, to cover the same $10,000. You cut price to sell more, and the math demands that you sell more just to stand still.
Run three sales cases: conservative, expected, and aggressive. Tie each to a conversion rate and an ad cost you would pay. Lower conversion, a higher return rate, or a more expensive click all raise the units you must move. I want expected monthly unit sales at least 20% above break-even before I call the price "set." Anything tighter means one bad returns week puts you under water.
Build a Five-Year Outlook With a Monthly First Year
The U.S. Small Business Administration recommends four forecasts: income statements, balance sheets, cash-flow statements, and capital-expenditure budgets. For year one, use monthly or quarterly figures, not one annual blob.
The five-year view is the highway map. The monthly year-one view is the turn-by-turn directions. You need both. The highway map doesn't tell you which exit has a gas station.
Assumptions, in the order money moves
- Order volume by month. A flat "100 a month" hides January and a holiday spike.
- Average order value. One number, from your price tiers, not a wish.
- Return rate. Subtract it from gross sales before you talk about margin.
- Payment processing fees. A percentage plus a fixed amount per order. Use your processor's schedule.
- Fulfillment cost per order. The one-order build you already did.
- Marketing spend. By channel, by month, including months with zero sales.
- Inventory replenishment dates. The day you pay, not the day you hope to sell.
Order volume times order value is gross sales. Subtract returns and fees to reach net sales. Subtract cost of goods to reach gross margin. Subtract operating costs to reach profit. Separate revenue from cash, because you may pay the supplier before anyone buys the finished product.
The income statement tells you whether the business earns money. The cash-flow statement tells you whether the bank balance survives the months when profit looks fine on paper.
If those two stories disagree, believe the cash-flow statement. Our revenue forecasting methods page shows how to tie monthly order assumptions to that pair of statements without hiding the slow months.
Test Demand Before You Scale Spend
Early sales feel like proof. They often aren't. The Bureau of Labor Statistics reported that, across sectors, 66% of new establishments were still operating two years after birth, while only 44% remained four years after birth. That means 56% of that cohort were no longer operating by year four. These rates are not an ecommerce-only prediction. They are a warning that a good first month doesn't make a durable business.
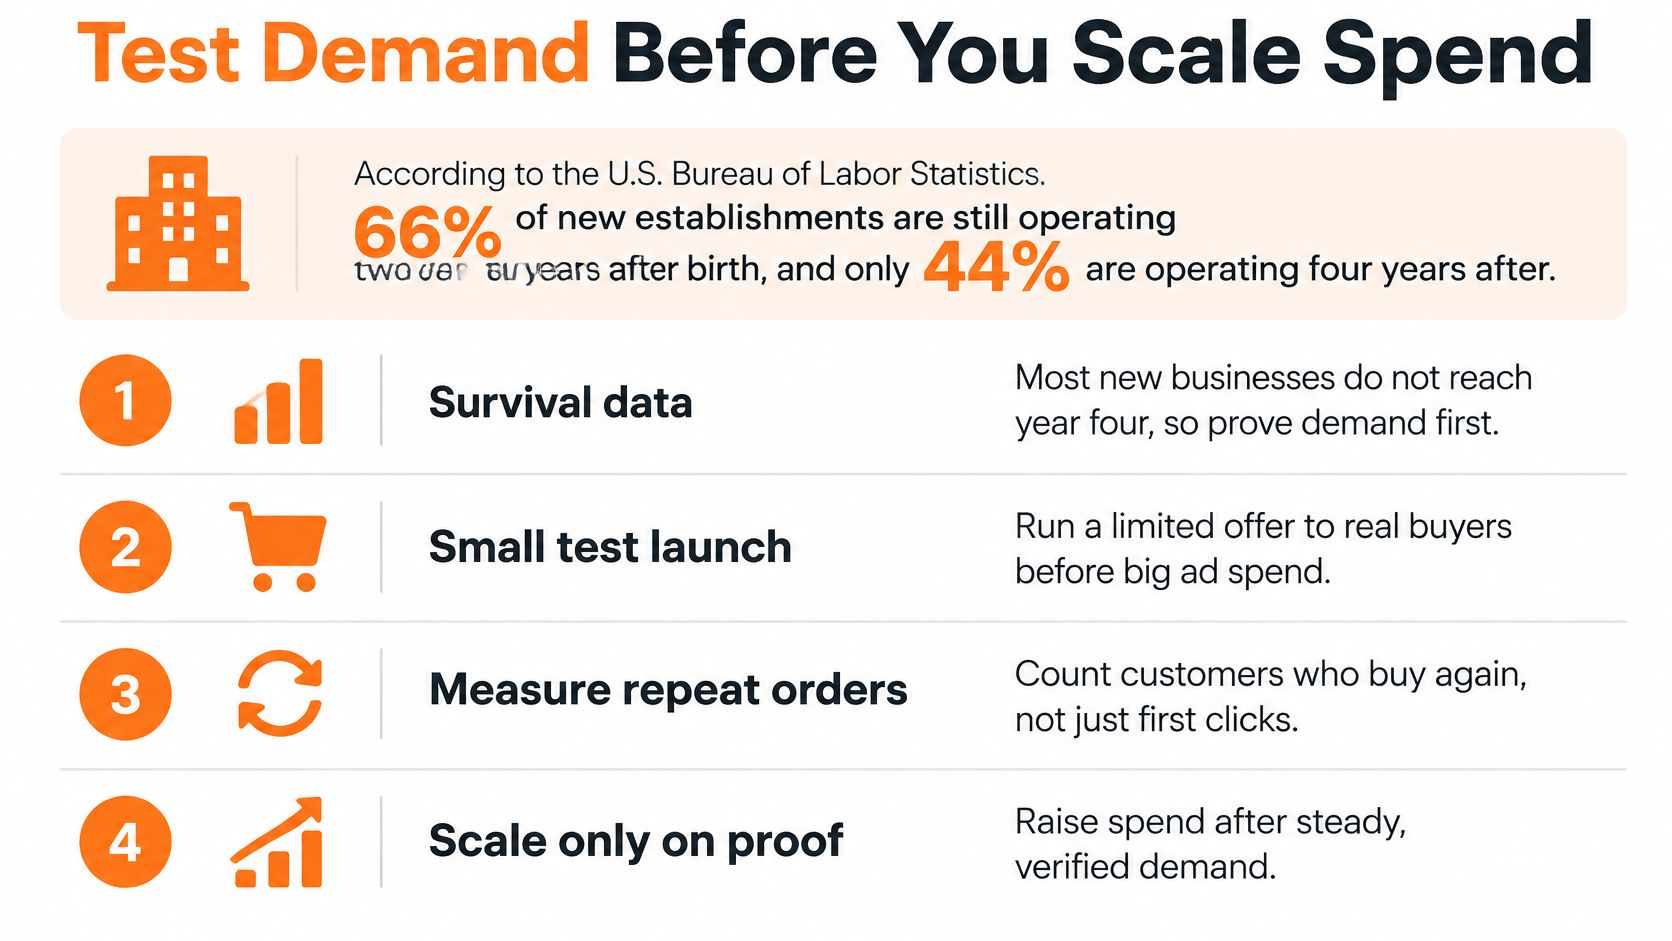
Write the pass and fail lines before you spend. If you write them after, you'll bend the result to match the hope.
- Five to ten customer interviews. Go when buyers name the problem and a price they'd pay. Stop and rewrite the offer if they like the idea and won't name a number.
- A single product page or a tiny MVP. Go when the page can take a real payment. Stop if you keep adding features instead of asking for the order.
- First paid orders from founder outreach or a marketplace. Go on paid orders, not email signups. Change the offer if nobody pays after 30 days of outreach.
- Gross margin on real orders after product, shipping, and fees. Go only if the margin matches the sheet. Stop the reorder if it doesn't.
- Repeat purchase at 60 to 90 days. Move ahead when the rate hits the target you wrote down. Don't scale on first clicks.
- Contribution margin after advertising. A first order that loses money is not traction. Measuring true ad ROI is worth doing before you raise the daily budget, because platform-reported return and cash return are different numbers.
- Cash runway in months. Go when the low month in your cash model still clears your minimum. Pause spend if it doesn't.
A short video on staging tests before you scale spend:
Survival stats don't predict your store. They do say you should budget for slower sales and a higher cost to acquire the next customer, then review the assumptions that connect demand to profit. I treat a failed test as a cheap answer. A scaled failure is an expensive one.
Plan Growth Channels and Retention Costs
The growth plan should show what happens when paid acquisition gets expensive, not only what happens when the ads work. Start with a no-paid-ads baseline: founder outreach, a marketplace listing, a partner, a local event. Those channels are slower. They also tell you whether anyone wants the product before a media buyer does.
Work one order in public. Contribution after product, shipping, fees, and returns is $18. Paid acquisition costs $25 to win that customer. The first order loses $7. The channel only pays if the customer orders again. Traffic that doesn't come back is a cost center with a dashboard.
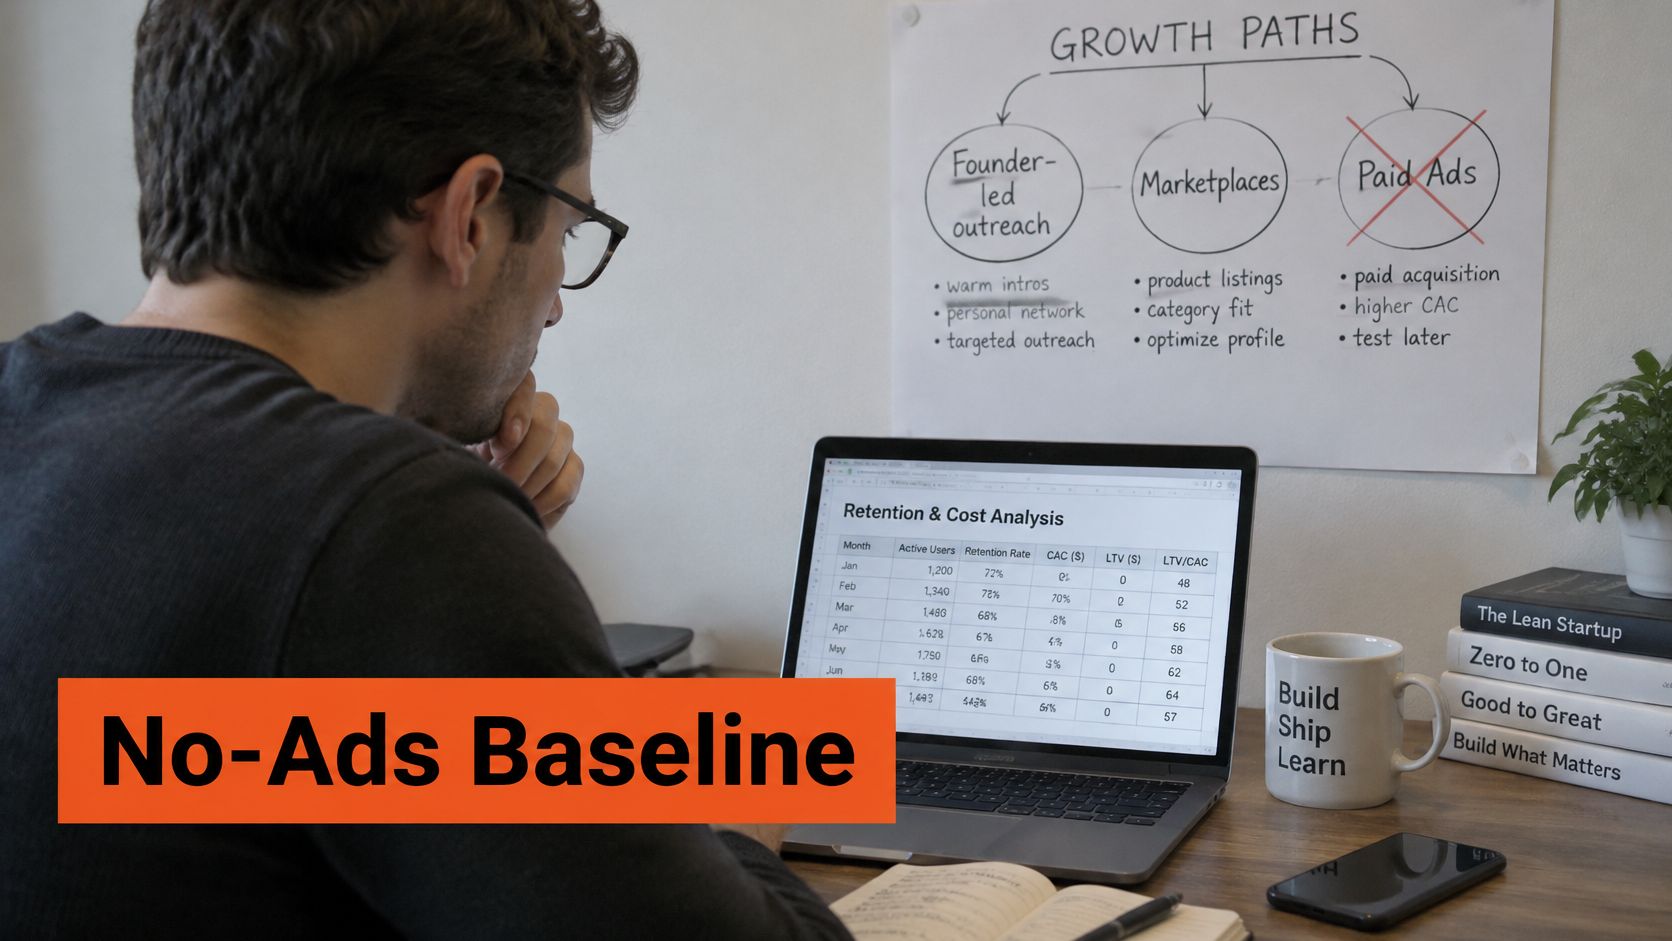
Compare channels by money, not visits
- List each channel with its cost per order. Founder time has a cost. Write an hourly rate so "free" outreach isn't free.
- Estimate the repeat rate for that channel. A marketplace buyer and a buyer from your own list rarely behave the same way.
- Model 12-month customer value from repeat orders, not from the first receipt.
- Stress the model. Ad costs 30% higher, conversion 20% lower. If the channel dies in that case, it doesn't get the next dollar.
- Name one channel for the next dollar and a number that would make you stop.
Repeat buying depends more on checkout, delivery that shows up when you said it would, and a returns process that doesn't feel like a fight than it does on a discount code. A cheaper first sale can be the worse customer. I track one retention number before any other: the percent of buyers who order again within 90 days. If you want a clean set of numbers for spend decisions, KPIs for profitable ecommerce ad spend lays out contribution, payback, and repeat rate in one place so you aren't managing the business off click-through rate.
Turn Your Plan Into a Monthly Review Routine
Month three looks fine on the P&L, then payroll hits before last month's orders pay out. That gap is why the plan comes back off the shelf on a set day, before anyone raises ad spend.
Run four checks, in this order.
- Track four numbers: cash balance, break-even units, contribution margin, and repeat-purchase rate.
- Compare actuals with the monthly year-one forecast. Flag any variance above 10%. A 10% miss on orders and a 10% miss on cash are different problems. Write down which one you have.
- Update the assumption that drove the miss, then rerun break-even and the cash model. Leave the inputs wrong and the next forecast repeats the same miss.
- Pick one action for the month and write the result you expect. One action. "Do better" is not an action.
Cash can miss while contribution margin holds. That usually means timing: inventory paid early, or payouts landing late. Margin can miss while cash still looks fine, which means the next reorder will be thinner than the forecast assumed. I would not fund the next campaign until both numbers have been rewritten from the actuals.
If you are building in Chicago or the Midwest, you can apply to join Chicago Brandstarters. It is a free, vetted community for kind, bold, hard-working Chicagoans and Midwesterners who are starting brands, and it helps members grow and increase their impact from $0 up to 7-figures. In small dinners and a private group chat, founders share honest war stories, tactics, and support while they build from an idea toward seven figures. Visit Chicago Brandstarters.
Leave a Reply