
You're about to decide whether to hire, restock, launch a product, or preserve cash. Three spreadsheets give you three different revenue numbers, and each founder behind them can explain why theirs looks right. That situation usually means the model has no shared definition of revenue, no clear evidence standard, or assumptions that nobody recorded.
No single method wins in every situation. Use market-size and comparable-company methods for long-range planning. Use unit economics and pipeline analysis for operating plans. Add historical, seasonal, cohort, and leading-indicator methods once your business has enough usable data. A practical guide to revenue forecasting can help you set up the wider planning process, but the model still needs your judgment.
Treat every forecast as a range, not a fact. Build a base case, then test downside and upside assumptions. The right revenue forecasting methods give you a transparent way to change the inputs when reality changes.
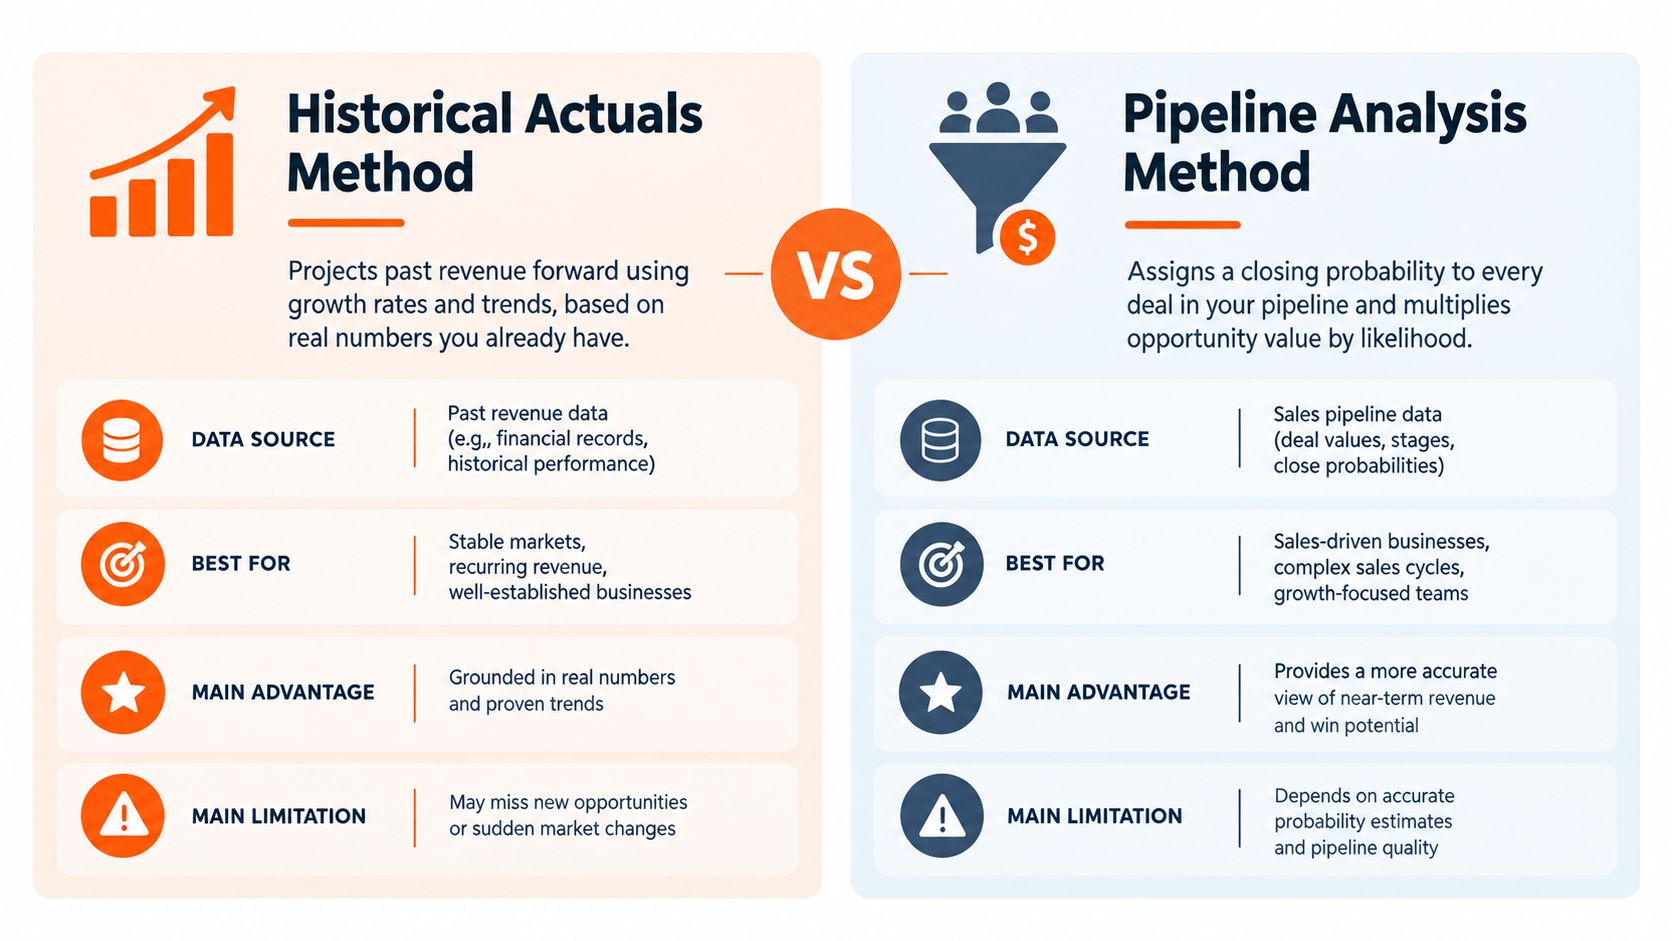
1. Historical Actuals Method
Historical actuals are the simplest starting point. You take revenue from prior periods, identify a repeatable pattern, and carry that pattern into the future. If last month produced $10,000 and the business has grown 20% month over month, the next-month projection becomes $12,000. The arithmetic takes seconds. Deciding whether that growth can continue takes more work.
This approach suits an established ecommerce store with a stable sales rhythm or a SaaS company with steady churn and expansion. Revenue forecasting has used historical patterns for decades, moving from time-series techniques to exponential smoothing, regression, neural networks, and deep learning as data and computing capacity expanded, as described in this history of revenue forecasting. The foundation remains familiar, historical data, trend detection, and judgment.

How to build it in a spreadsheet
Put months across the top and revenue streams down the side. Use several historical periods rather than copying the latest month, then separate recurring revenue from one-time spikes. A 12-month average or a same-month-last-year comparison gives you a basic reference point, while exponential smoothing gives recent periods more weight, according to this historical revenue forecasting guide.
Adjust the result for known changes, including a product launch, a new marketing campaign, pricing changes, or a market disruption. Update the file monthly and compare the forecast with actual revenue.
Mistake check: Historical data can't predict a business model that no longer exists.
Fit by stage: Established businesses with repeatable revenue patterns should start here. Pre-revenue founders need another method.
For a broader planning process, connect this model to your financial planning for startups, especially when hiring or spending decisions depend on the forecast.
2. Pipeline Analysis Method
A pipeline forecast asks a direct question: which open opportunities can produce revenue, and when? List every active deal, order, proposal, or customer conversation. Assign each opportunity a probability based on its stage and past conversion behavior, multiply value by probability, and add the results.
A $5,000 deal with a 50% closing probability contributes $2,500 to the weighted forecast. A B2B SaaS founder can apply this logic across active prospects, while an ecommerce brand can use it for seasonal wholesale orders from retail partners. A services business can apply it to signed proposals and likely project start dates. This pipeline forecasting method connects the model to current commercial activity rather than relying only on last period's results.
Make stage probabilities mean something
Use consistent benchmarks. Early interest might carry a 10% probability, a sent proposal 40%, and a negotiation 75%, but those figures only help when your team applies them consistently and checks them against actual outcomes. Track sales-cycle length as well. A deal can look likely and still miss the forecast period if procurement usually takes longer than the close date suggests.
Review the pipeline weekly. Keep lost deals in a separate record, often called a graveyard, so you can inspect why opportunities failed. You can also use this sales data analysis guide to connect lead volume, close behavior, and average deal size.
Practical rule: Weight opportunities by evidence, not by the salesperson's enthusiasm.
Fit by stage: This works best for B2B, high-ticket ecommerce, and project-based services with identifiable opportunities.
Mistake check: A full pipeline doesn't equal probable revenue. Stale deals, duplicate opportunities, weak stage definitions, and unrealistic close dates can inflate the result.
3. Cohort Analysis Method
A cohort groups customers by a shared starting point, usually the month or quarter when they joined. You then track how much each group retains, spends, expands, or churns as time passes. A January cohort may behave very differently from a June cohort because your pricing, onboarding, product, or acquisition channel changed.
Subscription businesses, membership sites, subscription boxes, and repeat-purchase ecommerce brands can use cohorts to separate two different stories. New customers create acquisition growth. Existing customers create retention, expansion, and repeat-purchase revenue. When you put those stories in separate rows, your forecast becomes easier to test.
A simple cohort layout
Place acquisition month on the vertical axis and months since acquisition across the horizontal axis. Each cell can hold retained customers, revenue per customer, or repeat orders. A new acquisition forecast then feeds the next cohort row, while historical retention behavior supplies later-period assumptions.
For example, if your January customers usually place a second order after several months, you can forecast that repeat revenue separately from new customer sales. If a newer cohort retains less well, don't average it away. The difference may point to a changed channel, weaker onboarding, or a product issue.
Mistake check: A blended customer average can hide falling retention behind strong new-customer growth.
Fit by stage: Use cohorts once you have enough customer history to compare groups. It has less value before you can observe repeat behavior.
Worked example: A membership site forecasts new members in one row, expected retained members in later columns, and average revenue per retained member in a separate row. The total comes from multiplying those visible inputs.
The practical mechanics are easier to see alongside this short cohort and revenue forecasting video.
4. Comparable Company Method
A comparable-company forecast gives you an outside reference when your own history is thin. Find businesses with a similar customer, product, pricing model, geography, and sales motion. Then use their public operating clues or disclosed milestones to test whether your projection sits within a believable range.
Suppose a comparable business reaches $5 million in revenue with 100,000 customers, while you have 20,000 customers. A simple proportional reference would suggest $1 million at the same revenue per customer. That doesn't make the number true. It gives you a question to investigate: do your customers spend similarly, and can you acquire them at a similar pace?
Choose comparables with discipline
Use three to five comparables rather than one. Look at public investor presentations and company case studies, then adjust for differences in market, product quality, team capacity, pricing, and distribution. A direct-to-consumer brand might study Warby Parker's early customer-acquisition economics. A B2B SaaS founder might compare customer growth and retention with another SaaS company that sells to the same type of buyer. A local service company can study mature competitors in other cities.
The method works best as a sanity check. It can expose a forecast that assumes unusually fast adoption or one that ignores realistic market capacity.
Fit by stage: This suits an early-stage company with limited internal history and a longer planning horizon.
Mistake check: A famous company isn't automatically a comparable. Similar branding or category language doesn't prove similar economics.
Worked example: A regional home-service founder lists comparable customer counts, average project values, and expansion paths. The founder then builds a bottom-up customer-acquisition model to test whether the proposed outcome can follow from actual sales activity.
Use this method for multi-year planning, fundraising discussions, and capacity decisions. Don't use it to promise next month's revenue.
5. Unit Economics Method
Unit economics turns revenue into the smallest pieces you can measure. Software revenue might equal customers multiplied by subscription price. Product revenue might equal units sold multiplied by price. A services forecast might equal qualified leads multiplied by close rate and average project value.
This method works like a recipe. If the final dish misses, you can inspect the ingredients. Did you acquire fewer customers, convert fewer leads, sell fewer units, reduce average order value, or lose more recurring customers than expected?
Build the driver sheet
Put unit drivers in rows and months in columns. A SaaS model might contain new customers multiplied by $99 per month, existing customers adjusted for churn, and expansion revenue. An ecommerce model might combine email subscribers, conversion rate, average order value, and repeat purchases. A services model might use qualified leads, close rate, and average project value.
Pipeline forecasting applies probabilities to active deals. Driver-based forecasting starts with operational inputs, including sales capacity, ramp curves, conversion rates, units sold, and average order value, then lets revenue fall out of the calculations, as this revenue forecasting methods guide explains.
Fit by stage: Founders can use this early, even before they have a long revenue history, because the model links activity to money.
Mistake check: Founders often overestimate conversion rates. Record the source and date for every assumption, then replace guesses with observed results.
Worked example: A product company forecasts units sold by channel, multiplies each channel by its price, and adds repeat orders. When actual revenue misses, the founder can see whether volume, price, or repeat buying caused the gap.
6. Seasonal Adjustment Method
Seasonal adjustment recognizes that revenue rarely arrives evenly across the year. An ecommerce business may sell far more during the holiday period. A landscaping company may earn little or nothing during winter. A back-to-school product may concentrate sales in July and August.
Start with a baseline forecast, then apply a seasonal index. Divide each month's average revenue by the annual monthly average. A month above one lifts the baseline, while a month below one lowers it. This separates an expected calendar pattern from underlying growth.
Keep seasonality separate from growth
Plot at least 24 months of data when you have it, then check whether the same pattern repeats. Don't mistake a growing business for a seasonal one. If every month rises because customer count increases, a seasonal index alone will understate future revenue. If November rises because demand reliably changes, a trend line alone will miss the timing.
An ecommerce company might forecast its fourth quarter at three times its normal monthly average. A snow-removal company might model zero revenue in warm months. Those assumptions need a cash plan, because peak revenue can arrive months before the slow period.
Fit by stage: Use this when you can identify a repeatable calendar pattern. New businesses should treat seasonality as an assumption to test rather than a fact.
Mistake check: A single unusual promotion can look like seasonality. Check the cause before you repeat the pattern.
Worked example: A retailer calculates average revenue for each month, divides each figure by its annual average, and applies those indices to a unit-economics baseline. The model then links peak-season receipts to cash flow management for small business.
7. Market Size and Penetration Method
Market-size forecasting starts with the outside opportunity. Estimate the total market, narrow it to the customers you can reach, and model the share you might capture. If a national product market reaches $100 million and you forecast 2% penetration, the resulting reference revenue is $2 million.
That calculation helps you discuss long-range potential. It doesn't tell you whether customers will buy next month. Founders often use total addressable market, or TAM, when they need a broad ceiling. Your serviceable addressable market, or SAM, should be smaller because it excludes customers you can't serve due to geography, product fit, pricing, regulation, or distribution.
Test the top-down story from the bottom up
Start with market reports, then speak with customers and sellers to check whether the category definition matches buying behavior. A pet-product company might estimate the national pet market and then narrow it to a particular product, customer type, and channel. A B2B software company might calculate TAM for one industry vertical. A regional service business might count households or companies inside its service area.
Then reverse the calculation. How many customers must you acquire? What conversion rate, average order value, sales capacity, and retention pattern would produce the proposed revenue? If the bottom-up model can't support the penetration claim, reduce the claim.
Fit by stage: This method fits three-to-five-year planning, investor discussions, and product-market sizing.
Mistake check: A large TAM doesn't prove demand for your product. Treat it as a ceiling and test the reachable market separately.
Worked example: A regional service founder estimates eligible businesses in the territory, assigns an average annual project value, and models customer acquisition by channel. The resulting forecast has a visible path instead of a percentage pulled from a headline.
8. Leading Indicators Method
Leading indicators help you forecast from signals that appear before revenue. Free-trial signups, qualified leads, email-list growth, website activity, product demos, and customer engagement can all point toward future sales. The signal only belongs in your model after you test whether it consistently precedes revenue.
A SaaS company might track free trials that usually convert about 30 days later. An ecommerce brand might connect email-list growth and engagement with later purchases. A services business might use qualified-lead volume to estimate future project revenue. Each example needs its own lag, conversion rate, and average value.
Prove the signal before trusting it
Map the customer journey from first action to payment. Record the earliest measurable event, the time between that event and revenue, and the conversion rate for each source. Then build a small dashboard with today's leading inputs and the predicted revenue period.
For example, if a channel brings 100 qualified leads, 10% usually close, and the average project value is $1,000, the model produces a $10,000 reference forecast. Those figures need regular validation, and you should separate channels when their conversion behavior differs.
Fit by stage: This becomes useful when you have enough customer and marketing data to observe a repeatable relationship.
Mistake check: Activity isn't automatically intent. A signup, click, or visit can rise while buying behavior weakens.
Worked example: An ecommerce founder tracks weekly email engagement, maps the normal delay to purchase, and compares predicted orders with actual orders. If the relationship breaks after a pricing change, the founder removes or revises the indicator instead of preserving a convenient assumption.
AI-assisted forecasting can refresh patterns as new data arrives, but it can't repair incomplete records, unclear revenue definitions, or a mismatch between booking dates and recognition timing. Start with clean inputs and a transparent spreadsheet before adding a complex model.
8-Method Revenue Forecasting Comparison
| Method | 🔄 Complexity | Resource Requirements | ⚡ Speed / Efficiency | 📊⭐ Expected Outcomes / Key Advantages | Ideal Use Cases / 💡 Tip |
|---|---|---|---|---|---|
| Historical Actuals Method | Low, simple calculations | Minimal, 3–12 months historical revenue | Very fast ⚡, quick to produce | Reliable short-term accuracy for stable patterns ⭐ | Established/mature businesses, adjust for known changes 💡 |
| Pipeline Analysis Method | Medium–High, deal-level tracking | CRM + disciplined sales input and regular updates | Moderate, recurring maintenance required ⚡ | Granular, deal-weighted forecast that highlights risk and opportunity ⭐ | B2B or high-ticket sales, standardize stage probabilities 💡 |
| Cohort Analysis Method | Medium, cohort setup and tracking | Detailed customer-level data and analytics tools | Slow, needs months of cohorts to stabilize ⚡ | Separates new vs. existing customer dynamics; improves LTV insight ⭐ | Subscriptions/repeat-purchase businesses, track cohorts over time 💡 |
| Comparable Company Method | Medium, research and adjustment | Market data, public filings, case studies | Moderate, research-heavy, less frequent updates ⚡ | provides benchmarked, market-grounded ceilings and sanity checks ⭐ | Early-stage or strategic sizing, use 3–5 comparables, not one 💡 |
| Unit Economics Method | Medium, model multiple drivers | Accurate unit/driver metrics and a simple model | Moderate, initial setup then iterative updates ⚡ | Shows exactly which levers affect revenue; transparent assumptions ⭐ | Productized or SaaS businesses, focus on 2–3 key drivers 💡 |
| Seasonal Adjustment Method | Low–Medium, apply seasonal multipliers | 12+ months historical data to identify patterns | Fast once established ⚡ | Prevents cash surprises and improves monthly accuracy around peaks ⭐ | Retail or seasonal services, separate seasonality from growth trends 💡 |
| Market Size & Penetration Method | Medium, market estimation and assumptions | Industry reports, customer research, TAM/SAM data | Slow, best for long-term planning ⚡ | Illustrates long-term ceiling and investor-facing potential ⭐ | 3–5 year planning / investor decks, build SAM bottom-up and be conservative 💡 |
| Leading Indicators Method | High, identify and validate predictors | Robust tracking, analytics, and experimentation | Fast predictive signal ⚡, forewarns revenue changes | Forward-looking accuracy if indicators validated; early action possible ⭐ | High-growth or changing businesses, validate indicators before relying on them 💡 |
Build One Forecast You Can Actually Use
Start with a unit-economics model. It gives you an operating view that connects customers, units, prices, conversion rates, churn, and capacity to revenue. Keep each driver in its own row, record the assumption beside it, and make the formula visible enough that another person can challenge it.
Add pipeline analysis for open deals. Use stage probabilities, expected close dates, deal values, and sales-cycle evidence. Remove stale opportunities instead of letting a large pipeline create false comfort. For recurring or repeat-purchase businesses, add cohorts once you can compare customer groups over time. Add leading indicators when you can show that a measurable action precedes revenue by a consistent interval.
Historical actuals and seasonal adjustments should shape the baseline when your business has repeatable patterns. A moving average can smooth unusual periods, while exponential smoothing gives recent observations more weight. Regression can connect revenue to drivers such as advertising spend or market conditions, but extra variables also create more places for weak data to distort the result. Keep the method proportional to the quality of your inputs.
Use market-size and comparable-company methods as longer-range checks. They can help you test whether your ambition sits within a plausible market and whether your growth path resembles businesses with similar economics. They shouldn't create a monthly promise when you lack customer, pipeline, or transaction evidence.
Build three scenarios. Your base case should use the assumptions you currently support. Your downside case should reduce the drivers most likely to miss, such as conversion, close timing, retention, or average order value. Your upside case should require specific evidence, such as more qualified demand or higher capacity, rather than wishful growth.
Track forecast quality by horizon. MAPE, WAPE, sMAPE, bias, and forecast value add can tell you whether a model fails in the month ahead, quarter ahead, or year ahead. A single accuracy number can hide systematic errors at the planning horizon you care about, as this forecast accuracy analysis explains. A practical benchmark many organizations use aims for a forecast within 5% to 10% of actual revenue, although the acceptable range depends on industry, deal cycle, and sales complexity, according to this revenue forecasting reference.
At month-end, compare forecast with actual revenue. Write down which assumption missed, why it missed, and what you'll change. A forecast becomes useful when it teaches you which inputs deserve trust.
Chicago Brandstarters is a free community where founders can discuss hard business decisions, honest mistakes, and practical tactics with other Chicagoans and Midwesterners. It can give you a place to pressure-test a forecast before you commit cash, hiring plans, or inventory.
Chicago Brandstarters gives kind, hardworking founders a free, vetted community with private dinner events and an active group chat for honest business discussions. Visit Chicago Brandstarters to meet other builders, share your forecasting assumptions, and get practical feedback on the decisions behind your numbers.
Leave a Reply