
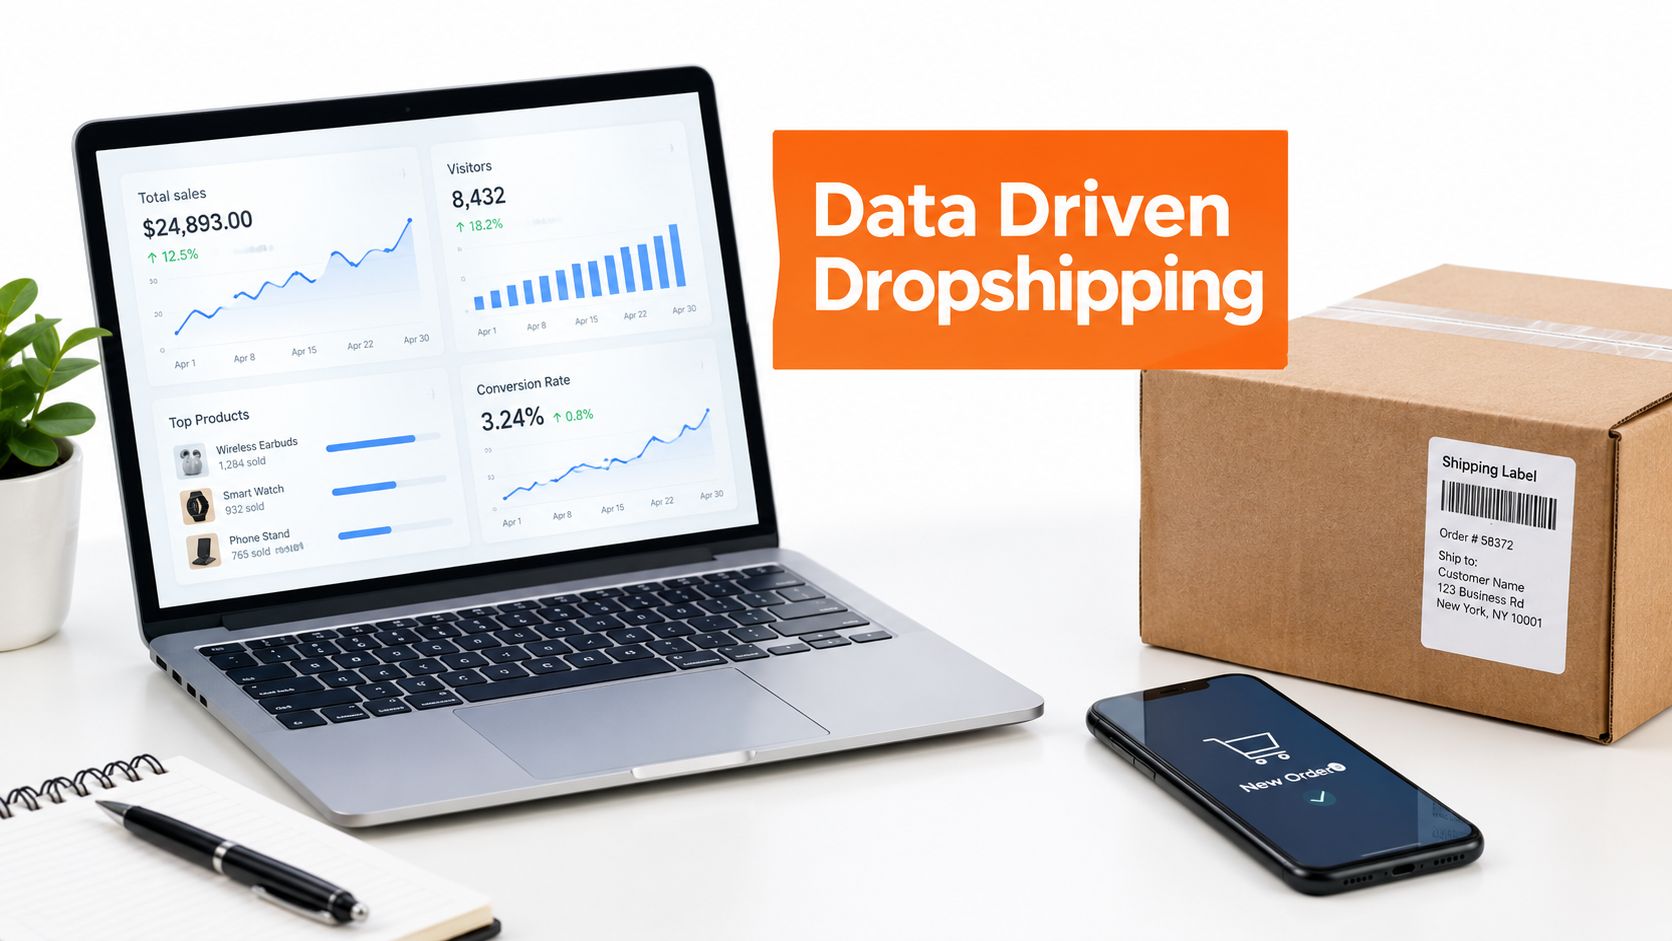
You're staring at a dashboard at midnight because checkout abandonment jumped, yet you can't tell whether the problem comes from the product, the page, the payment method, or the shipping promise. You open another ad report, compare a few supplier listings, and still end up making the same decision you made last week, based on instinct.
I rebuilt my store by replacing that loop with a simple rule: every important decision needs a recorded input, a threshold, and an exit. Data driven dropshipping isn't a premium upgrade for large teams. It's the operating method that keeps a small store from mistaking activity for progress.
Why Data Driven Dropshipping Is the Default Now
Dropshipping became easier to launch as marketplaces, storefront software, and fulfillment integrations connected demand, product catalogs, order routing, and shipping data. eBay launched in 1995, Amazon opened third-party selling in 2000, Shopify launched in 2006, and AliExpress launched in 2010. ePacket shipping became widespread around 2011, reducing friction for single-item cross-border orders, as described in this history of dropshipping infrastructure.
That sequence changed the operating model. You could test a product without buying deep inventory, watch conversion behavior, compare supplier performance, and remove weak products quickly. The store stopped behaving like a catalog and started behaving like a testing system.
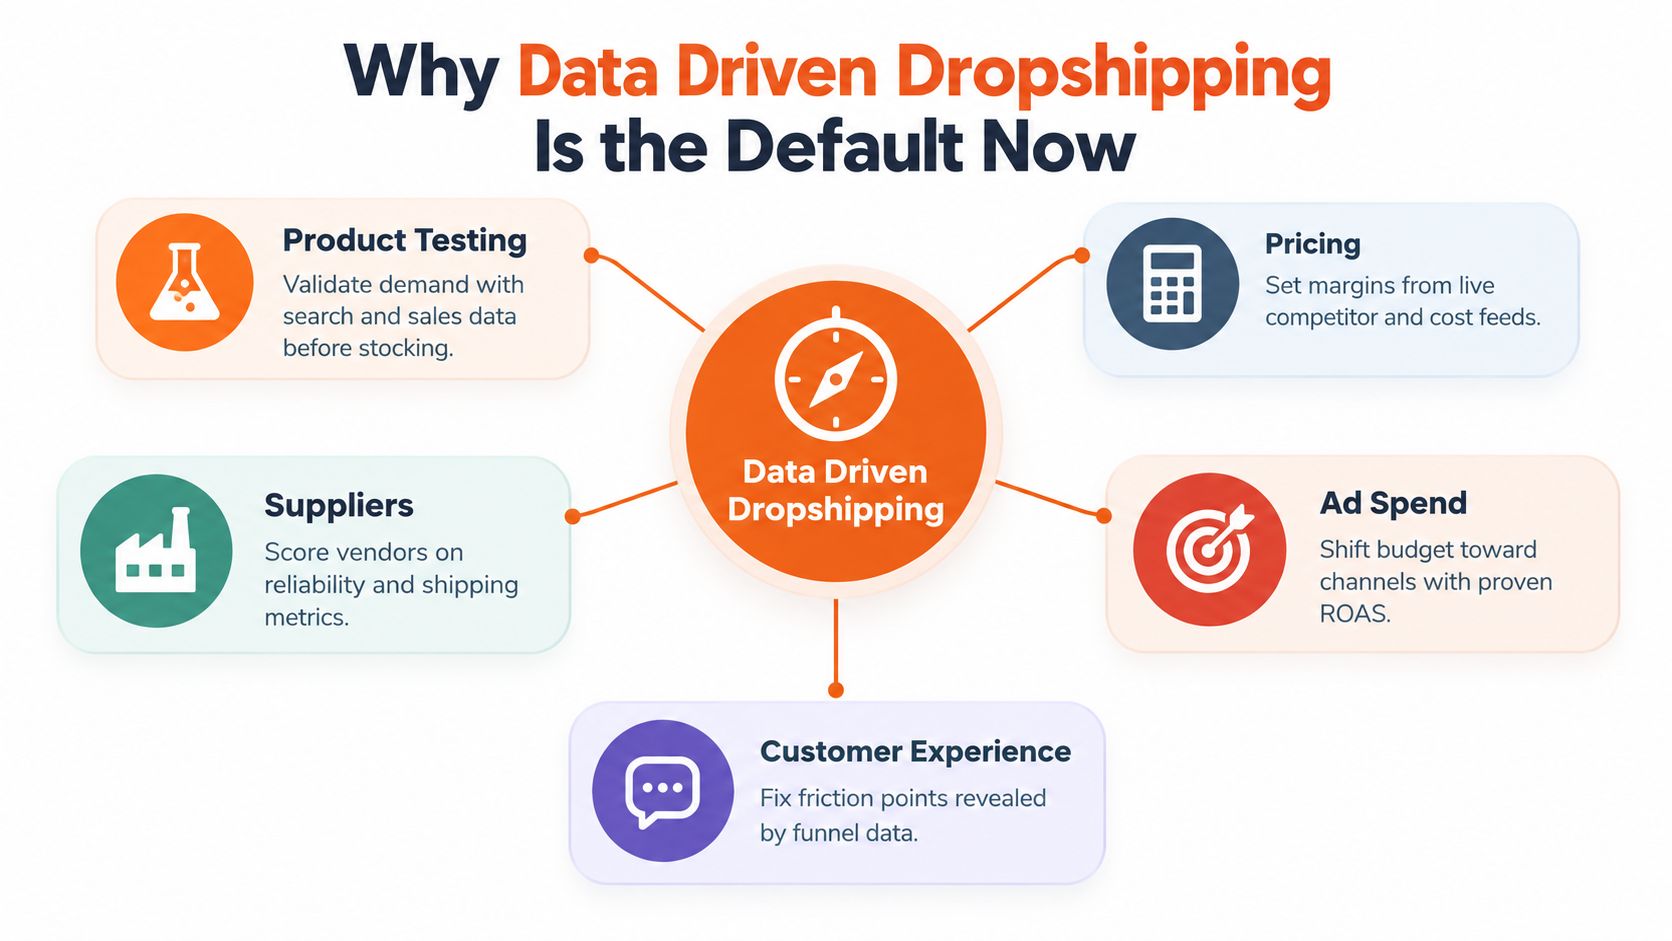
I use four data layers:
- Store data: Sessions, conversion rate, average order value, checkout completion, contribution margin, and refund rate.
- Product data: Landed cost, gross margin, add-to-cart rate, purchase rate, supplier handling time, and defect reports.
- Customer data: New versus returning buyers, cohort revenue, support reasons, refund patterns, and repeat purchases.
- Market data: Country-level conversion, payment method use, shipping time, duties, refund rate, and net margin per session.
Each layer answers a different question. Store data tells you whether the machine works. Product data tells you what deserves more traffic. Customer data shows whether the sale creates future value. Market data tells you where the same product makes or loses money.
Operating rule: A dashboard doesn't improve a store by itself. A documented decision tied to the dashboard does.
The category now has enough scale and competition to punish loose measurement. One 2026 estimate values the dropshipping market at USD 583.5 billion and projects USD 2.18 trillion by 2033, with a 20.7% CAGR from 2026 to 2033. Another 2026 estimate places dropshipping at roughly 27% of online stores' primary fulfillment models and about 23% of global ecommerce sales, while a separate forecast places the market at USD 0.51 trillion in 2026 and USD 1.35 trillion by 2031. The estimates use different methods, but the market research comparison points in the same direction, competition demands cleaner product, advertising, supplier, and margin decisions.
If you want a practical explanation of how measurement can drive ROI with data, focus on the habit rather than the software. Review the same fields every week, keep definitions stable, and stop changing targets after poor results.
Sourcing Products With Numbers You Can Trust
A product can look like a winner in a short video and still lose money after shipping, duties, returns, and weak supplier handling are included. Approve it only when demand, supplier economics, and delivery conditions pass the same screening process.
Start with one research sheet. Record the product name, source URL, search demand, marketplace demand, supplier, product cost, shipping cost, duty estimate, handling time, review evidence, target selling price, and the shipping lanes you plan to test. This sheet should make weak products difficult to defend. The Chicago Brandstarters sourcing of products guide documents supplier-vetting steps that support this workflow.
A practical validation framework recommends at least 10,000 monthly searches, an Amazon Best Sellers Rank below 50,000, with a rank under 10,000 indicating stronger volume, and 200 to 300 survey responses for meaningful feedback. Use those filters as evidence, not as a substitute for judgment. Search demand can look healthy while delivery promises or checkout margins fail.
The screening sequence
Pull demand signals before contacting suppliers. Compare marketplace demand, search data, and audience feedback. The independent product research and validation framework provides a useful starting point for this sequence.
Calculate landed cost for every destination country:
Landed cost = product cost + shipping + duties
A supplier page can show an attractive product cost while customs, delivery upgrades, and return handling make the order unworkable. Country-level landed cost belongs in the first product decision, not in a later finance review.
Use this table as your operating filter. The first thresholds come from the validation framework above. The supplier and saturation fields are practical screening rules I use, so apply them consistently and record the evidence behind each result.
| Metric | Pass Threshold | Fail Signal |
|---|---|---|
| Monthly searches | At least 10,000 | Demand lacks enough visible search activity |
| Amazon Best Sellers Rank | Below 50,000 | Rank sits above the demand screen |
| Survey feedback | 200 to 300 responses | Opinions rely on a tiny sample |
| Landed cost share | Under 30% of retail | Shipping and duties leave little room |
| Supplier handling | 14 days or shorter | Delays weaken the test |
| Supplier reviews | 4.3 or higher from at least 200 reviews | Thin or weak supplier evidence |
| Repeated ad hook | Fewer than roughly 25 distinct advertisers using the same hook, counted through the ad library | Creative saturation threatens margin |
The repeated-hook threshold is my practical screen, not a published benchmark. Search the ad library, count distinct advertisers using the same opening or promise, and save examples with the research sheet. If the count is already high, assume you will pay more to earn attention.
Shortlist 5 to 7 products. Log cost of goods sold, target margin, supplier handling, review evidence, and every flagged shipping lane. Test only after each threshold has a recorded value, an owner, and a next action. A product should earn its test budget through documented evidence.
What to do with missing data
Missing data is a fail signal until you resolve it. Ask the supplier for package dimensions, dispatch location, delivery service, tracking coverage, and return instructions. Order samples when quality claims could change the refund calculation. Also record who handles duties, returns, and customer support in each target country, because those costs can invalidate an otherwise attractive product.
Check whether the product solves a clear problem or fits a clear buying occasion. A broad “cool gadget” angle produces weak research categories and vague creative direction. A product tied to a specific use case gives you a cleaner way to compare search intent, page language, buyer objections, and country-level conversion potential.
Reading Conversion Data Before You Spend
Conversion rate is a decision trigger, not a trophy. The store average tells you where to investigate, while the product and country segments tell you what to change.
Independent ecommerce benchmarks put general dropshipping stores at 1% to 2% conversion, niche stores at 2% to 4%, and top-performing one-product stores at 4% or more. Another benchmark reports a 2.33% dropshipping average in its dataset, as shown in this dropshipping conversion rate benchmark.
That gives you a useful operating range:
| Funnel Metric | Healthy Range | Action Trigger |
|---|---|---|
| General store conversion | 1% to 2% | Below 1% calls for offer or page review |
| Niche store conversion | 2% to 4% | Above 2% can support controlled expansion |
| One-product store conversion | 4% or higher | Protect quality before adding spend |
| Click to purchase | Track by product | Under 0.8% after 1,000 clicks, pause |
| Cost per acquisition | Compare with AOV | Above 35% of AOV, review economics |
| Gross margin after returns | Track by SKU | Below 25%, revisit price or supplier |
A store at 1.2% conversion doesn't need more traffic first. It needs stronger proof on the product page, clearer delivery information, better reviews, and fewer unanswered objections. More clicks only multiply the leak.
A store at 3.0% conversion with 60% cart abandonment has a different problem. The product and page can persuade visitors, but checkout creates friction. Test a shorter checkout, local payment methods, clearer duties, and a delivery estimate that matches the destination.
Read the funnel in order
Start with the ad click. If the creative attracts curiosity but the product page fails to generate add-to-carts, check message match, price, reviews, images, and shipping terms. If add-to-carts look healthy but purchases remain weak, inspect payment errors, surprise costs, delivery uncertainty, and trust signals at checkout.
Keep your dashboard simple:
- Sessions and clicks show whether the traffic arrives.
- Product views and add-to-carts show whether the offer earns interest.
- Checkout starts show whether buyers accept the initial terms.
- Purchases show whether the complete transaction works.
- Contribution margin shows whether the sale deserves repetition.
Decision rule: Never scale a product because conversion looks good before you subtract landed cost, refunds, payment fees, and acquisition cost.
Use country, device, creative, and product segments. An overall conversion rate can hide a profitable mobile audience, a broken payment method, or a shipping lane that produces refunds. The right question isn't “What's my conversion rate?” It's “Which visitors complete a profitable order, and why?”
Testing Ads and Pricing on the Same Loop
I test ads and price together because they change the same outcome. A creative can produce cheap clicks and poor buyers. A price can improve margin and reduce conversion. If you isolate each decision, you'll blame the wrong variable.
Use a campaign budget optimization structure with 3 to 5 ad sets, 2 to 3 video creatives in each ad set, a daily budget of about $20 to $50 per ad set, and a test window of 3 to 5 days, following this dropshipping ad-testing framework.
For a clean test, keep the product page, audience, attribution window, and offer stable. Change the creative angle, not every part of the campaign at the same time.
| Metric | Pause | Hold | Scale |
|---|---|---|---|
| Cost per purchase | Above your recorded ceiling | Between ceiling and target | Below target with stable quality |
| Contribution margin | Negative after ads and shipping | Positive but thin | Positive with room for refunds |
| Checkout completion | Repeatedly weak | Mixed by device or country | Stable across major segments |
| Hook rate | Weak versus account baseline | Acceptable | Strong with purchase intent |
| Price test | Conversion falls sharply | Within the comparison band | Higher price holds conversion |
The guide's setup gives you a test structure. My decision sheet adds the economics. Record hook rate, hold rate, checkout completion, cost per purchase, selling price, landed cost, refund reserve, and contribution margin in one row for each creative.
Put a price floor under every winner
Calculate this before you raise spend:
Price floor = landed cost + payment fees + expected refund cost + target acquisition cost + required contribution
If cost per purchase plus shipping consumes more than 30% of selling price, adjust the price floor before you increase budget. Cheap traffic can still produce an unprofitable order.
Test two price points with a 50/50 traffic split. Raise the price only when conversion stays within 15% of baseline and contribution margin improves. If the higher price drops conversion outside that band, return to the lower price and improve proof, bundles, or the offer before trying again.
Use $35 as the pause line and $18 as the scale trigger only when those thresholds fit your own average order value and margin sheet. A cost per purchase means nothing without the selling price beside it.
Kill weak creatives without killing the product
A weak hook doesn't prove weak demand. Compare the first seconds of the video, the promise, the demonstration, and the landing-page match. Pause the creative when it fails the purchase threshold, then keep the product alive if another angle earns qualified checkout activity.
Choosing Markets and Shipping Lanes With Better Math
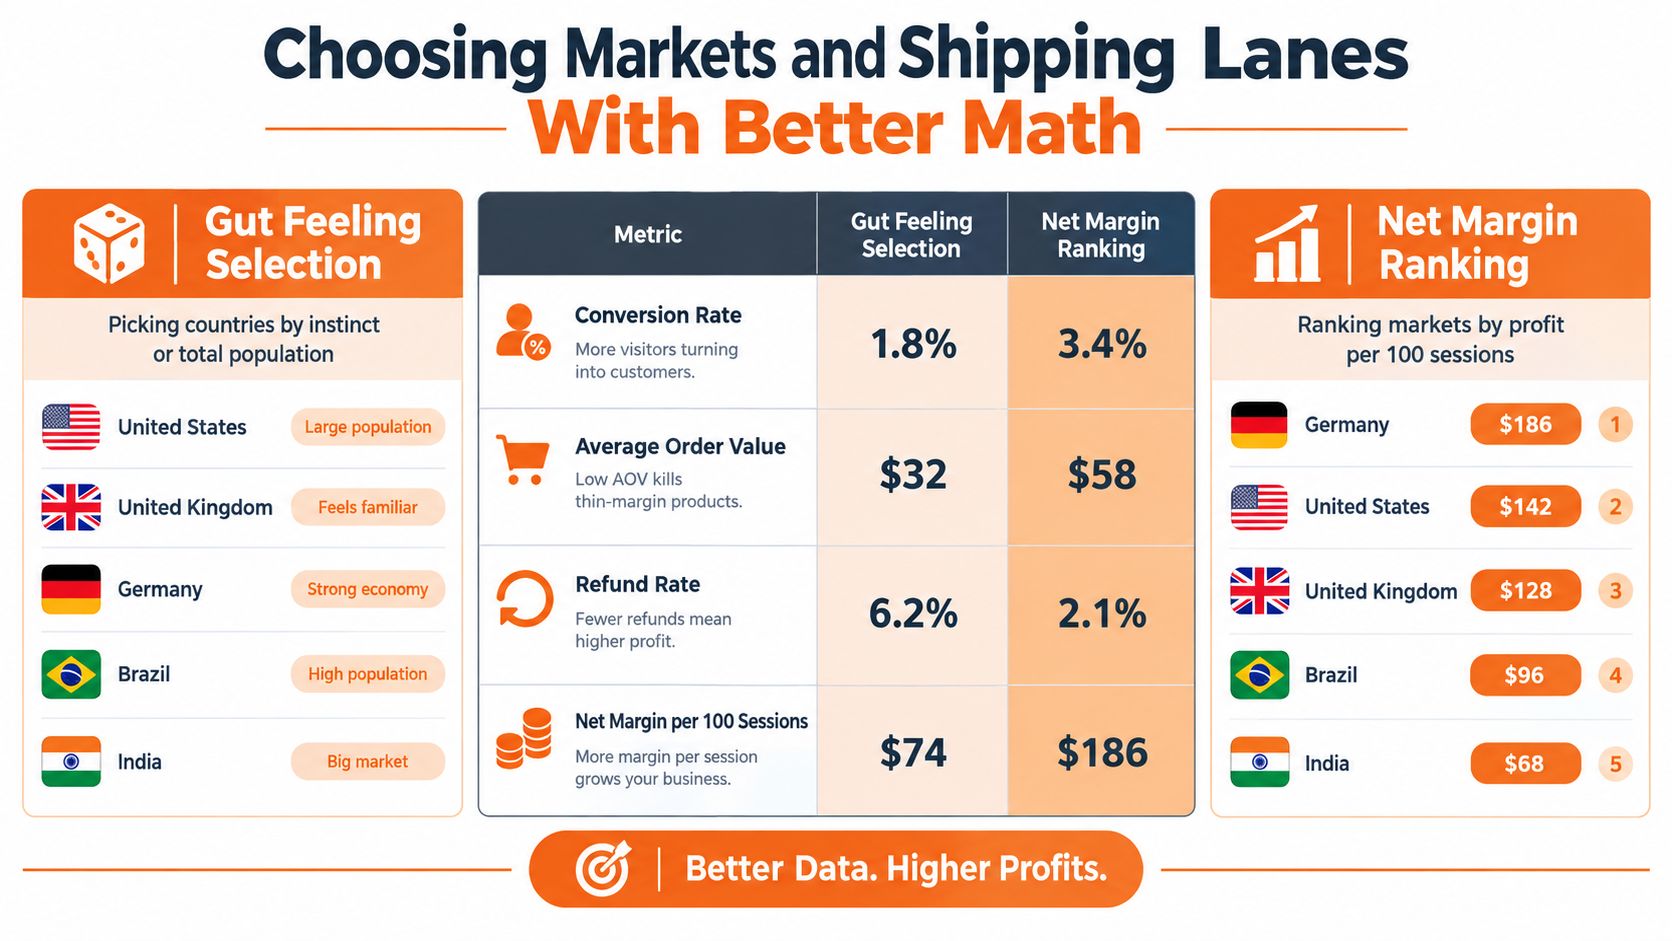
The right product can lose money in the wrong country. Founders often rank markets by population, language familiarity, or a single successful order. That approach treats the product as the only variable and hides the economics inside shipping, duties, refunds, and payment behavior.
Pull your store data by ISO country code. Rank each market by net margin per 100 sessions, using conversion rate, average order value, refund rate, landed cost, duties, delivery time, payment fees, and support load.
A country scorecard should contain:
- Demand: Sessions, product views, add-to-cart rate, and purchases.
- Order value: Average order value and bundle uptake.
- Delivery: Shipping cost, transit time, tracking quality, and customs exposure.
- Risk: Refund rate, failed delivery rate, chargebacks, and support contacts.
- Profit: Revenue minus product cost, freight, duties, payment fees, refunds, and ad spend.
This is why a cheaper shipping lane can still lose. A US lane with 7-day delivery and $4 shipping may beat a UK lane with 18-day delivery and $2 shipping once refund probability enters the calculation. Those figures are a practical example of lane math, not a universal benchmark.
Build a monthly market scorecard
Use a fixed formula so your ranking doesn't change because you had a good sales day. I'd score each country on conversion, contribution per session, delivery reliability, refund behavior, and landed-cost volatility. Then I'd review the bottom market before I review the top one, because the bottom market usually contains the clearest leak.
Cross-check demand with Facebook Audience Insights and Google Market Finder. Demand confirmation matters, but it doesn't override your store's actual country-level economics.
Chicago Brandstarters' shipping and logistics guide is useful when you need to document the shipping model, promise, policy, KPI review, and partner checks behind the scorecard.
The near-term advantage belongs to operators who model the complete transaction before scaling. Customs surprises can cause abandonment. Slow delivery can raise support volume. Localization can change conversion. Test the country, lane, and fulfillment setup as one unit, then compare it with the same product in another market.
Staying the Seller of Record Without the Paperwork Surprise
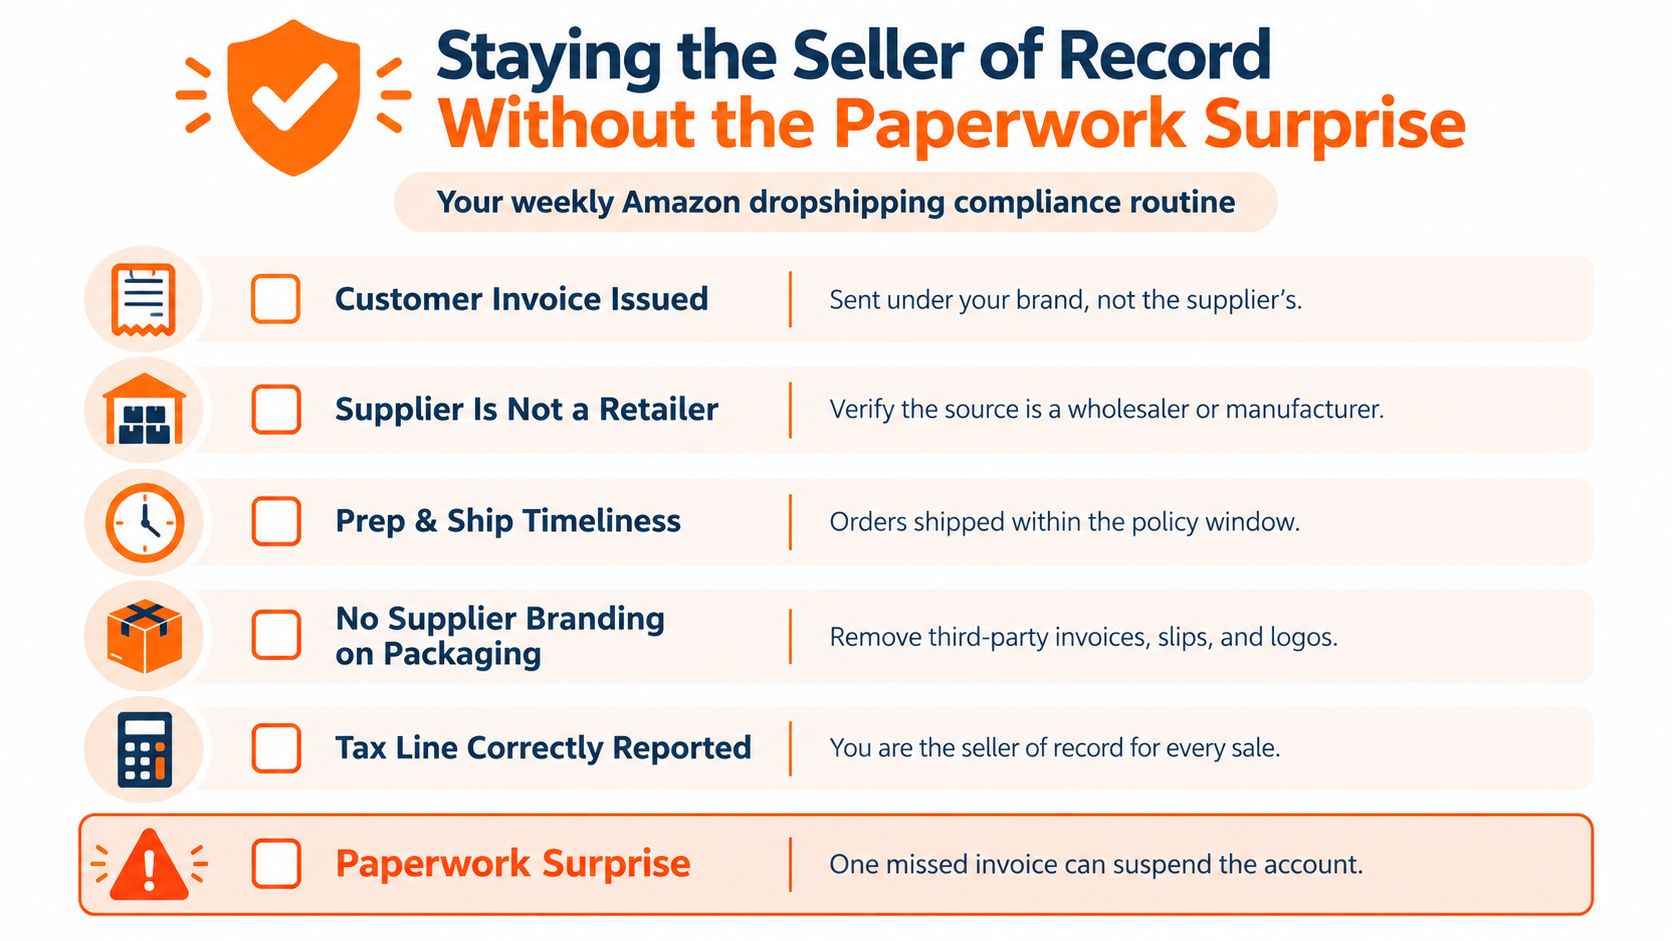
Dropshipping doesn't transfer responsibility to the supplier. On Amazon, you can use a third-party fulfillment partner only when you remain the seller of record. Amazon requires packing slips, invoices, and external packaging to show your name only, and you remain responsible for returns and policy compliance under its seller of record dropshipping policy.
Amazon's own guidance also says you set the price, record the purchase as revenue, and handle sales tax when you act as seller of record. That makes bookkeeping part of the operating system, not an afterthought, as explained in Amazon's dropshipping guidance.
Run a weekly ownership check
Keep a folder for every order batch and supplier purchase order. Your checklist should cover:
- Customer invoice: Issue it under your business identity with the correct VAT or sales tax information.
- Supplier record: File the purchase order and split product cost, freight, and duty.
- Packaging: Confirm the shipment contains no supplier invoice, logo, or external branding.
- Returns: Keep a usable return address and document who handles inspection and refunds.
- Tax treatment: Record the transaction under your seller-of-record responsibility and review marketplace rules for each jurisdiction.
For EU orders under €150, track the IOSS treatment that applies to your transactions. For US orders, review marketplace facilitator rules by state and check whether your own obligations change after a revenue threshold. Don't place a tax assumption in a spreadsheet and forget it. Give it an owner and a review date.
A resource on global tax compliance for e-commerce merchants can help you compare the responsibilities that remain with your business and those that a merchant-of-record arrangement may handle.
Compliance rule: If your invoice, packaging, return process, and tax entry don't identify your business clearly, you don't control the transaction cleanly enough to scale it.
Your Weekly Operating Rhythm
A dashboard only earns its keep when it drives a recurring decision. I use one sheet with product, selling price, landed cost, contribution margin, CPA, ROAS, refund rate, and days of stock. I sort the sheet by contribution margin after ads, because revenue can disguise a weak product.
| Day | Primary Review | Key Metric | Decision Trigger | Owner |
|---|---|---|---|---|
| Monday | Spend and CPA review | CPA versus target | Pause when CPA exceeds 1.6 times target CPA | Founder or media buyer |
| Tuesday | Creative refresh | Hook and hold rate | Replace weak hooks with new angles | Creative owner |
| Wednesday | CBO test review | Purchases by ad set | Keep, pause, or duplicate based on purchase quality | Media buyer |
| Thursday | Inventory check | Days of stock | Reorder or reduce spend against the 28-day safety-stock target | Operations owner |
| Friday | Landed-cost reconciliation | Contribution margin | Reprice, renegotiate, or pause when margin falls | Finance owner |
| Sunday | Cohort and market review | Country conversion and retention | Choose scale, hold, or sunset | Founder |
Monday should feel blunt. Review spend, CPA, purchase quality, and refund risk. If a campaign exceeds 1.6 times target CPA, pause it before you invent a story about learning.
Tuesday and Wednesday belong to creative. Refresh hooks, test new demonstrations, and use the same CBO structure from the ad section. Don't change the price, page, audience, and creative all at once, or you'll lose the reason behind the result.
Thursday is for stock. Compare days of stock with a 28-day safety-stock target. If a supplier delay threatens that buffer, reduce spend before the product becomes unavailable. If stock builds too quickly, stop buying and let contribution data decide whether to discount or sunset.
Friday is accounting day. Reconcile product cost, freight, duties, returns reserve, payment fees, and seller-of-record filings. A missing duty entry can make a bad product look profitable. A missing refund reserve can make a good product look better than it is.
Make Sunday the exit meeting
Reserve 90 minutes on Sunday for cohort retention, country-level conversion, shipping performance, and one decision per product:
- Scale: The product has profitable contribution, reliable fulfillment, and a repeatable acquisition signal.
- Hold: The product earns evidence but needs a specific fix.
- Sunset: The product misses its threshold after the planned test and has no credible next change.
Write the decision beside the product. Add the metric that caused it and the next review date. That small act replaces memory with a record.
You don't need a complicated analytics stack to run data driven dropshipping. You need consistent definitions, honest landed costs, country-level reporting, and the discipline to stop weak tests. Start with five products, one sheet, one market scorecard, and a weekly review that ends with scale, hold, or sunset.
Chicago Brandstarters gives early-stage founders a free, vetted community with small private dinners, an active group chat, and practical peer support for building ecommerce brands from idea stage toward seven figures. If you want operator feedback on your product tests, shipping math, or store decisions, visit Chicago Brandstarters and apply to join.
Leave a Reply