
You just paid for a logo, ran some ads, and sold your first few hundred units. Now someone asks if your brand is worth anything. You stare at your Shopify dashboard. You see revenue. You don't see proof that people remember you, pick you on purpose, or pay more because your name is on the box.
I want you to stop looking for one magic score. When you ask how do you measure brand equity, you really ask a simpler question. Do people react better to your product with your brand on it than to the same product without your brand? You can measure that gap with surveys, order data, and free tools you already have.
Brand Equity Metrics and Where Each Number Comes From
I treat the table below as a menu. You don't order every dish. You pick the rows that fit your stage, your budget, and the decision in front of you.
You can split customer-based brand equity into six parts. A validated measurement instrument in Revista de Administração de Empresas treats brand awareness, brand image or associations, perceived quality, loyalty, willingness to pay a premium, and exclusivity as separate metrics. That study reports an average loyalty score of 0.60, an exclusivity score of 1.69, and an average willingness-to-pay figure of R$108.49. You don't need those exact numbers. You need the structure, because one vague score hides the problem.
Consider it a health check. Awareness tells you if people know you exist. Associations tell you what they think you mean. Perceived quality tells you if they trust the product. Loyalty tells you if they come back. Willingness to pay tells you if your name adds dollars. Exclusivity tells you if they see a swap as easy or hard.
I add two numbers that sit closer to revenue. Net Promoter Score shows if customers say they'll recommend you. Customer lifetime value shows what a customer brings in over time after product costs.
| Metric | How to Measure It | Data Source | Startup Proxy |
|---|---|---|---|
| Unaided awareness | Share of buyers who name your brand first for the category | Survey panel or customer calls | Ask 20 new customers which brands they name first |
| Aided awareness | Share of buyers who recognize your brand from a list | Survey panel | Recognition question in a 5-brand poll |
| Brand associations | Words customers link to your brand, rated on a 1-5 scale | Survey with open-ended items | Tag words from post-purchase emails |
| Perceived quality | Quality rating against named competitors | Survey and public reviews | Average star rating and review themes |
| Loyalty | Share of customers who buy again within 12 months | Order export | Repeat customers divided by total customers |
| Willingness to pay | Price premium over an unbranded version of the same product | Price test or conjoint survey | Two-price test on one product page |
| Net Promoter Score | Percent who score 9-10 minus percent who score 0-6 on recommend intent | Post-purchase survey | One question in your order confirmation email |
| Customer lifetime value | Order value times purchases per year times gross margin times years retained | Sales and order export | Spreadsheet from a Shopify or Stripe export |
Read the Table Like an Operator
You get awareness from people, so you ask people. You get loyalty and lifetime value from orders, so you export orders. You get willingness to pay from a real price choice, so you run a small price test and watch what people do.
Start here: You can't judge perceived quality or loyalty for a brand people don't recognize, so you measure awareness first and you work down the table.
Say you sell hot sauce in Chicago. You ask 20 farmers market buyers to name hot sauce brands. Two name you first. You have a memory problem, and a fancy loyalty score won't fix it. You fix the first row before you chase the last row.
How to Run a Brand Equity Survey Step by Step
You run a good survey like a taste test. You keep the food the same. You change only the label. The gap in response tells you what the label adds.
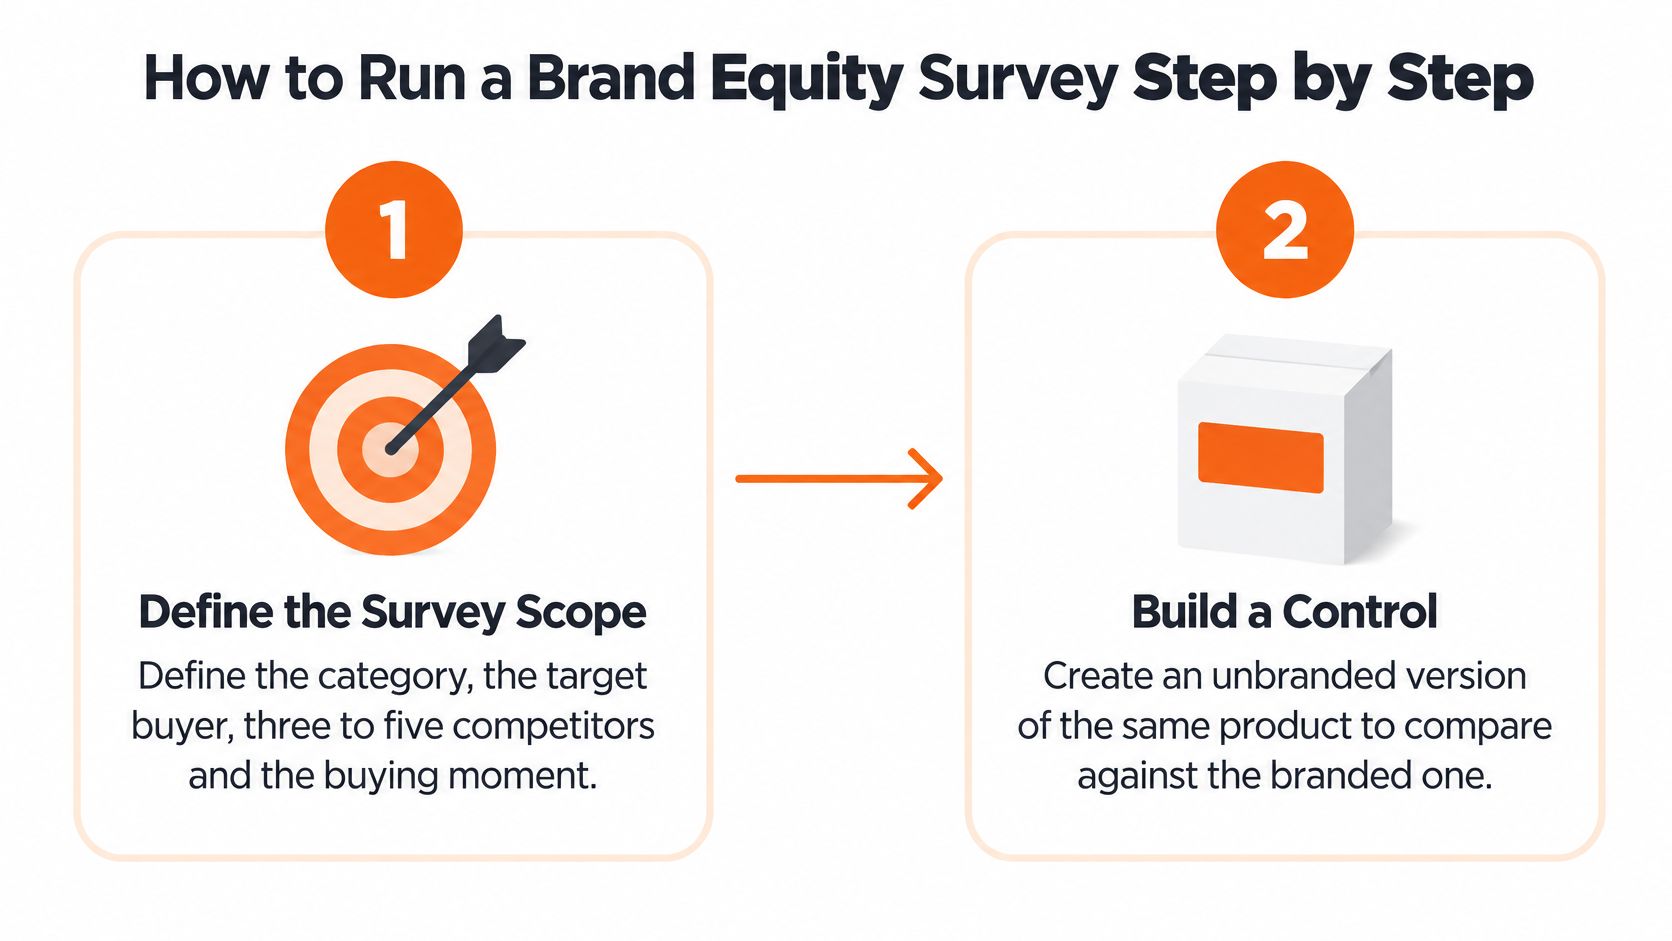
The flow below shows you the first two moves.
Kevin Lane Keller defines brand equity in his 1993 Journal of Marketing article as the differential effect of brand knowledge on consumer response. You copy that logic. You compare branded and unbranded versions and you measure the lift.
The Seven Steps I Use
Define the scope. You name the category, the target buyer, three to five competitors, and the buying moment.
You need a tight scope because "people who buy snacks sometimes" gives you noise you can't act on.Build a control. You make the same offer with no brand name, or you invent a plain name.
You need a control because you measure a gap, and a gap needs two sides.Recruit enough buyers. You aim for at least 200 category buyers per condition from a panel, and you set quotas for age and location.
You need that size because small samples swing wildly when ten people change their minds.Ask unaided recall first. You ask, "Which brands come to mind for this category?" Then you show a list and you ask about recognition.
You ask in that order because a list plants names in memory and ruins the recall test.Measure each idea with three or more questions. You use three or more Likert items for associations, perceived quality, and loyalty, and you check Cronbach's alpha of 0.7 or higher.
You check alpha because your questions for one idea should move together. If they don't, you wrote fuzzy questions.Randomize the brand test. You show half the group your branded offer. You show half the group the control. You keep price, photos, and product details identical.
You randomize because you want the brand cue to explain the lift in purchase intent or willingness to pay.Repeat each quarter. You keep the same wording, sample rules, and competitor set each time.
You repeat the same way because you want change over time, and you can't read change if you move the ruler.
What You Do With the Result
Say 32% of the branded group says they'll buy and 24% of the control group says they'll buy in your own test. You read the eight-point lift as your brand effect for that offer, that buyer, and that moment. You don't read it as a universal brand score.
You also watch for a trap. People overstate purchase intent. They say yes in a survey and they walk past the shelf in real life. I treat intent as a direction arrow. I check it against real choice when I can, with a price test, a landing page test, or a best-worst choice task where people pick a favorite and a least favorite from a set.
You don't treat Net Promoter Score as total equity. One recommend question can't tell you if people recall you, trust your quality, or pay more for you. You let each metric answer its own question.
Calculate Customer Lifetime Value and NPS
I start with money people already spent. You can calculate customer lifetime value from an order export this afternoon.
Use this formula.
Customer lifetime value = average order value × purchases per year × gross margin × years retained
You include gross margin because revenue alone lies to you. A $100 order with $90 in product and shipping costs leaves you $10. A $60 order with $20 in costs leaves you $40. The second customer feeds your business. The first customer mostly feeds your suppliers.
Walk Through a Candle Example
Say you run a candle brand. Your export shows a $48 average order value. Your repeat buyers place 2.5 orders a year. Your gross margin sits at 60%. Your cohort data shows customers stay for 3 years on average.
You multiply in order. $48 × 2.5 gives you $120 a year in revenue. $120 × 60% gives you $72 a year in gross profit. $72 × 3 years gives you $216 in customer lifetime value.
| Input | Example Value | Where to Find It |
|---|---|---|
| Average order value | $48 | Revenue divided by order count in your sales export |
| Purchases per year | 2.5 | Orders per customer over 12 months |
| Gross margin | 60% | Revenue minus cost of goods, divided by revenue |
| Years retained | 3 | Average customer lifespan from cohort data |
| Customer lifetime value | $216 | $48 × 2.5 × 60% × 3 from the inputs above |
You pull average order value from Shopify or Stripe in one export. You count orders per customer over 12 months for purchase frequency. You use your cost sheet for margin. You build simple cohorts by first-order month for years retained, because a guess about retention turns your whole calculation into fiction.
Calculate NPS Without Fooling Yourself
You ask one question after a first order heals into a real experience. "How likely are you to recommend us to a friend?" You use a 0-10 scale.
You count scores of 9-10 as promoters. You count scores of 7-8 as passives. You count scores of 0-6 as detractors. You subtract the detractor percentage from the promoter percentage.
Say 100 customers answer. You get 45 promoters, 35 passives, and 20 detractors. You subtract 20 from 45. You get an NPS of 25.
You need volume before you trust the number. Under 100 responses, two angry customers can drag your score down several points in one week. I read small-sample NPS as comments with a number attached. I read the words first.
You place CLV and NPS beside your survey numbers. CLV shows behavior in dollars. NPS shows attitude in one answer. Neither number equals brand equity on its own, and together they tell you if happy talk matches repeat money.
Turn Brand Strength Into a Dollar Figure
The photo below shows you the test in plain form. Two plain mugs sit side by side, and your brain adds value when you put a name you trust on one of them.
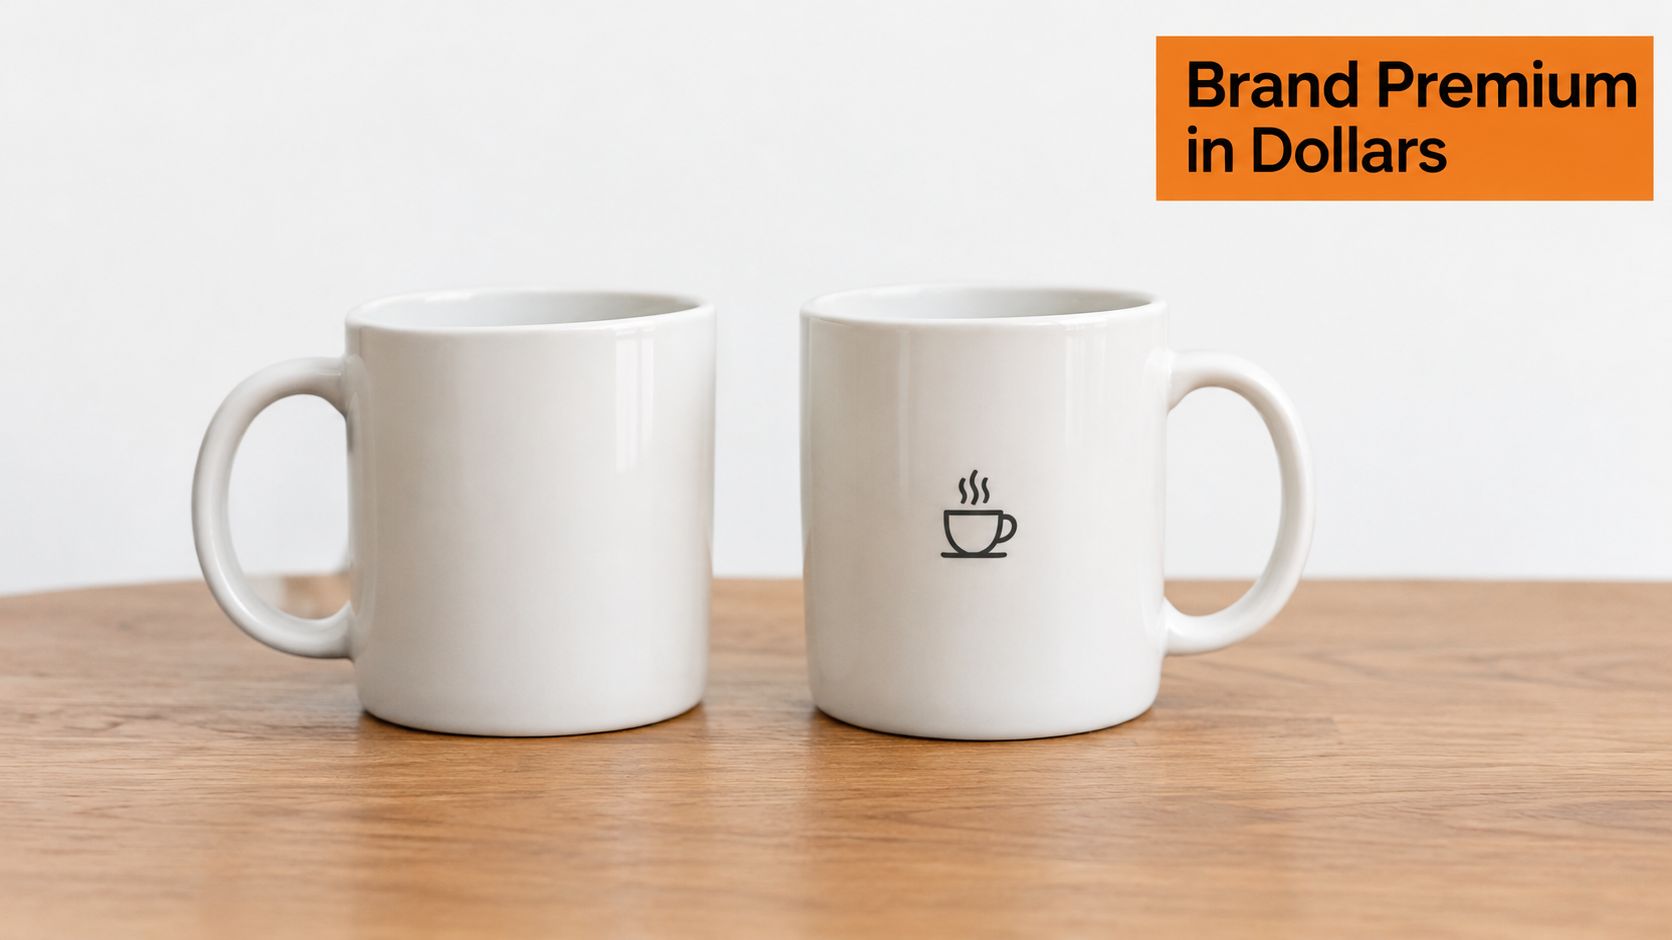
A dollar figure answers a different question from a survey. A Penn State World Campus lesson on brand equity states the financial definition plainly. Brand equity equals the present value of future branded-product profit minus the present value of future generic-product profit. You forecast profit for both versions, you discount each forecast, and you subtract the generic result from the branded result.
Interbrand-style work adds steps. Analysts judge financial performance, the role branding plays in demand, and brand strength. Then they discount brand-attributable earnings to present value. You can copy the logic at startup scale without hiring a valuation firm.
Run the Bottle Math
Say you sell a water bottle for $32. A plain bottle with the same steel, lid, and size sells for $24. Your price premium equals $8. You divide $8 by $24 and you get a 33% premium.
You multiply the premium by units sold. You sell 1,000 bottles a year in this example. $8 × 1,000 gives you $8,000 in extra yearly revenue tied to price. You subtract the extra marketing spend you use to hold that premium. If you spend $2,000 a year on content, samples, and events that support the higher price, you keep $6,000 as your yearly brand-linked amount before other costs.
You can watch a walkthrough of branded versus generic value before you build your own sheet.
Then you discount future years because a dollar next year buys less certainty than a dollar today. You pick a rate that matches your risk, you apply the same rate each year, and you report a range. I show a low, middle, and high case. One exact number looks smart in a deck and fools everyone in the room.
Watch Three Traps
- Discount-driven premium: You claim a $32 price and you run 30% off every month, so customers really pay about $22 and your premium vanishes.
- Feature-driven premium: Your bottle keeps drinks cold twice as long, so product performance explains the price and your brand gets credit it didn't earn.
- Double-counted loyalty: You count repeat profit inside CLV and you count the same repeat profit again inside your brand premium.
For most startups, I stop at premium, units, extra brand spend, and a discounted range. A full valuation can wait until you have several years of clean sales, price, and retention data.
Startup Proxies When a Survey Is Out of Reach
You can track equity before you can buy research. You watch behavior each month and you look for a pattern. A digital-brand measurement model in Marketing Management Journal combines sentiment, reach, search volume, and engagement, and it notes that surveys, financial reports, and sales data can give you an incomplete view online.
I take the warning inside that model seriously. Engagement doesn't equal equity. Likes can come from a creator with a big audience, a funny post, or a fight in your comments. None of those prove people will choose you at checkout.
Your Monthly Proxy List
- Branded search share: You check Google Search Console and Google Trends and you count searches with your name against total search clicks you get.
- Direct traffic share: You check analytics for visits with no referrer, because people who type your name or use a bookmark remember you.
- Branded versus generic conversion: You compare conversion rate for your brand name terms against plain category terms, because memory should convert better.
- 90-day repeat rate: You group customers by first-order month and you count who buys again within 90 days.
- Discount share: You divide orders with a discount code by total orders, because rising discount use often means weak price power.
- Review themes: You tag reviews by hand in a spreadsheet for quality, shipping, scent, taste, fit, or service.
- Referral rate: You count new customers who use a referral link or code and you divide by total new customers.
You add local signals when you sell locally. You track the share of orders from your target city. You count referrals from Chicago events and partner shops. You ask new customers at checkout which neighborhood store, gym, or market sent them to you. National awareness means little when you need buyers inside ten miles.
Likes tell you someone tapped a screen. Repeat orders, branded searches, and full-price sales tell you someone remembered you and chose you again.
You add 20 short customer interviews each quarter. You ask what they bought before you, what almost stopped them, and what words they use for you. You write down exact phrases and you tag themes.
You keep the same definitions every month. You compare this month with your own past. Published benchmarks from bigger categories and bigger budgets will mostly make you chase the wrong target.
Mistakes That Make Your Brand Equity Numbers Lie
You can have high awareness, busy social accounts, and weak brand equity at the same time. I see the pattern in the numbers. People know your name. They won't pay more. They don't come back without a coupon.
A 2024 systematic review in Cogent Business and Management found that brand-equity models vary a lot and no approach has adequate validation as a reliable single quantification. You protect yourself when you connect perception, behavior, and economics and you build a counterfactual, meaning a fair with-brand and without-brand comparison.
Six Mistakes and the Fix Beside Each One
- You treat one composite score as equity. You fix it when you report awareness, associations, perceived quality, loyalty, and premium as separate lines.
- You read NPS alone as brand strength. You fix it when you place NPS beside repeat rate, CLV, and review themes.
- You credit the brand for a sales spike. A discount, a new flavor, or a retail placement can lift sales. You fix it when you split revenue by source and you hold promotions, product changes, and distribution steady in your comparison.
- You compare two unlike months. December and February behave differently for most products. You fix it when you compare against the same season last year or you note seasonality and media spend on the same sheet.
- You count loyalty twice. You fix it when you decide if repeat profit lives in CLV or in your premium math, and you count it in one place only.
- You compare your survey with a published benchmark. A national beverage benchmark won't judge your Chicago skincare brand fairly. You fix it when you benchmark against your own baseline and your named competitors in the same survey.
You can use cheap counterfactuals before you can run big tests. You track cohorts by first-touch source. You compare branded search conversion with generic search conversion. You run a small price or message test in one market or one email segment. You record discount dependence every month.
Use a simple final check. If awareness rose and retention, full-price sales, and price tolerance stayed flat, you gained fame without equity. You need stronger associations, better product proof, or a clearer reason to pay.
Pick Your First Three Metrics This Month
Pick three metrics, one from each layer. Choose unaided awareness or associations for perception, 90-day repeat rate or branded search share for behavior, and CLV or price premium for economics. That gives you a measure of what people think, what they do, and what the brand can earn.
Then do five small jobs this month.
- Write each definition in one line. 90-day repeat rate equals customers who buy again within 90 days of their first order divided by all customers who first ordered in that period. Write your other two formulas the same way.
- Pull your baseline. Use the last 90 days of orders and search data, then save the numbers as row one in a sheet.
- Set a monthly review date. Put the date on your calendar and keep the same definitions each time.
- Run one small test. Try a two-price test on one product page or a new email subject line for Chicago customers.
- Write your guess first. Name the change you expect and the size you expect before the test starts, so you can grade your judgment later.
Keep each metric paired with a source you already have. A short survey can carry the perception question, order and search data can carry behavior, and your product-page test can support the economic read. After your first month, add one more behavior metric and schedule a quarterly survey.
If you build a brand in Chicago or the Midwest and want honest feedback on your first measurement sheet, Chicago Brandstarters runs free, vetted small-group dinners and an active founder chat for builders from idea stage to seven figures. Visit the site, read how membership works, and apply if you want peers who will help you test your metrics and your next price move.
Leave a Reply