
You're trying to set next quarter's ad budget, but your spreadsheet still has last month's unpaid invoices and a supplier deposit you haven't figured out how to fund. You find the percent sales method and think: finally, a formula that doesn't require a finance department. Use it. Just don't confuse a tidy calculation with a spending decision.
Why Founders Reach for the Percent of Sales Method
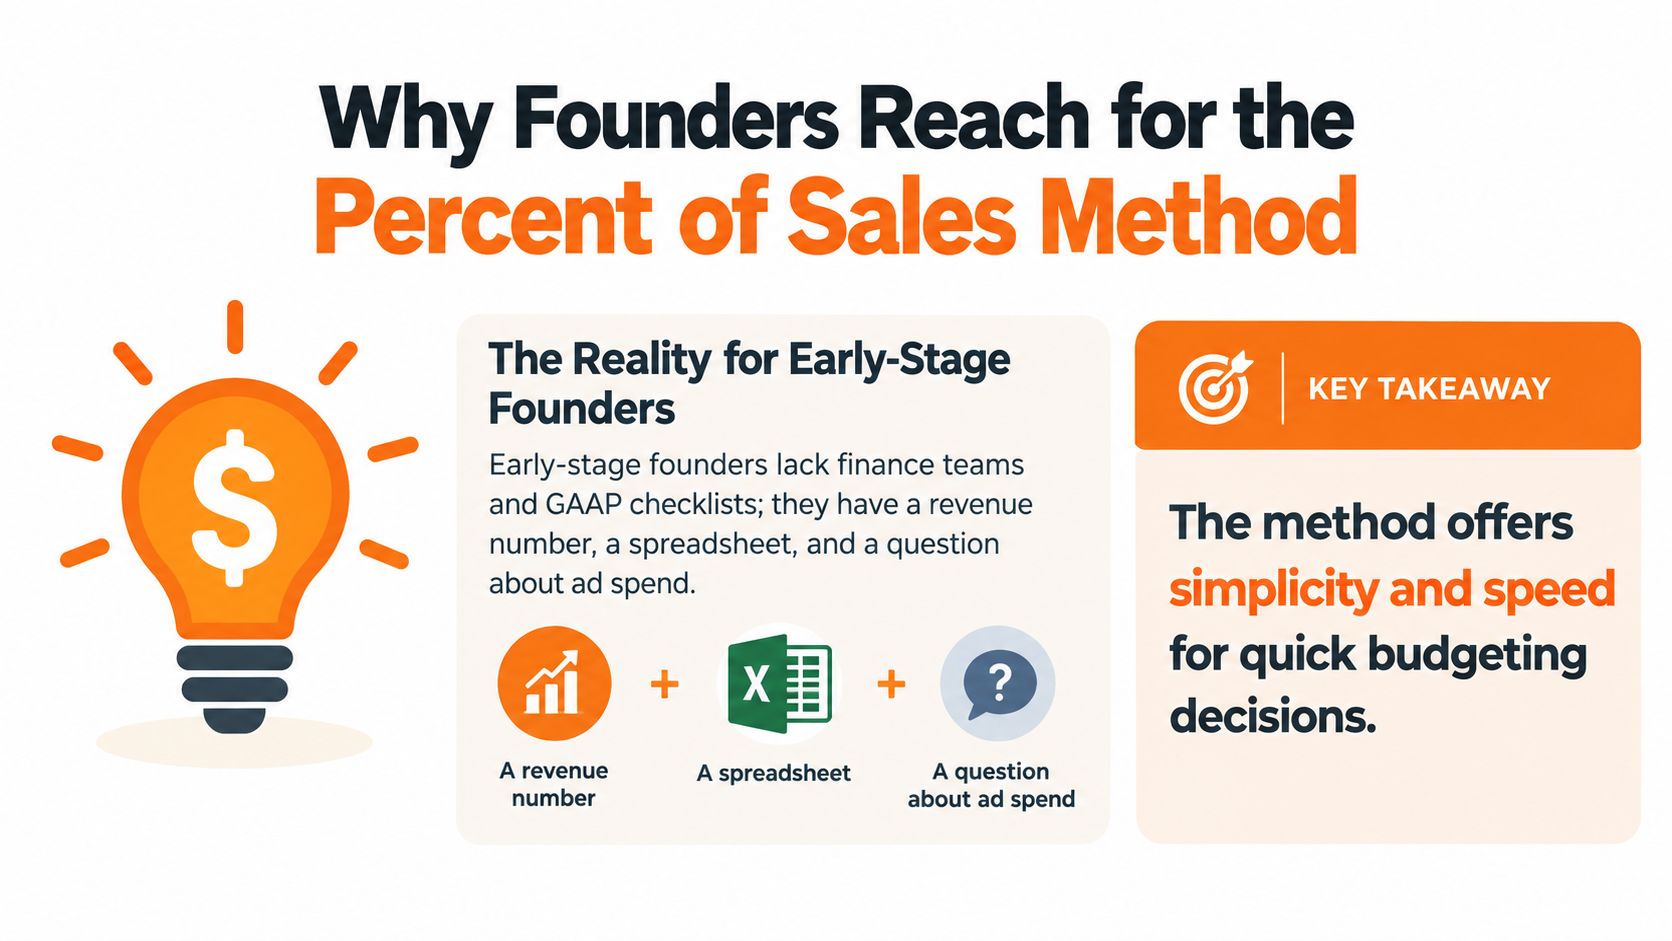
Your immediate problem isn't financial theory. You need to decide what you can spend, what you should reserve, and whether your growth plan requires more cash than you have.
So you pull up revenue, divide a few expenses by sales, and carry those percentages forward. I like that instinct. You're turning scattered transactions into assumptions you can inspect, challenge, and change.
Give the spreadsheet a specific job
Finance texts describe the percent-of-sales method as the most commonly used approach for projecting financing needs because you connect expected revenue to expenses, assets, and liabilities, as explained in O'Reilly's financial forecasting chapter. For a founder, that connection gives you a manageable starting point.
You can put the method to work on distinct questions:
- Marketing budget: How much spending would your chosen revenue percentage imply?
- Bad-debt expense: How much of your sales should you expect customers never to pay?
- Pro forma forecast: What might your income statement and sales-linked balance-sheet accounts look like under your revenue plan?
The practical appeal is easy to see.
Start with revenue you can defend
Before you multiply anything, explain your sales assumption in plain English. Which products will customers buy? Through which channels? What makes you believe those orders will arrive?
If you need help organizing that starting point, use the Electe sales forecast tutorial as a companion while you build your revenue worksheet. Keep your forecast assumptions separate from your spending decisions.
Practical rule: Give every percentage a job description. Don't let a convenient formula make a decision you haven't actually considered.
You should leave the spreadsheet knowing which assumptions came from experience and which came from judgment. I'll show you how to use the method without handing it control of your business.
The Core Idea Behind the Percent Sales Method
The percent sales method starts with a simple question: how large was this financial line relative to sales?
Divide the historical line item by historical net sales. Then multiply that ratio by projected net sales to estimate the future line item. Keep the periods consistent, because mixing a monthly expense with annual revenue gives you a useless ratio.
Calculate the relationship before forecasting
Use these formulas:
- Historical ratio: Historical line item ÷ historical net sales.
- Projected line item: Historical ratio × projected net sales.
- Assumption note: Your explanation of why you expect the relationship to continue.
For example, if cost of goods sold historically equals 42% of sales, applying that ratio to $500,000 in projected sales gives you $210,000 in projected COGS, using the Salesforce percent-of-sales example.
That calculation answers a narrow question: what would COGS look like if you maintained the historical relationship? You still need to decide whether your purchasing costs, product mix, or pricing justify that assumption.
Think of the ratio like a recipe. If you plan to serve more meals, you can scale the ingredients. But you can't assume you'll need another oven every time you add another plate.
Keep forecasting and accounting separate
You'll encounter the same method name in different contexts. In financial forecasting, you estimate future expenses and sales-linked assets or liabilities. In accounting, you estimate bad-debt expense from the current period's relevant sales.
Don't mix those purposes in the same unlabeled row. A forecast expense tells you what you expect; an accounting estimate supports what you record.
| Question | Forecasting version | Accounting version |
|---|---|---|
| What am I estimating? | Future financial line items | Current-period bad-debt expense |
| What assumption matters? | Continued relationship with sales | Expected uncollectible share |
| What should I review? | Operating conditions | Collection experience |
For shipping supplies, advertising, payment processing, and returns, I'd first check whether the historical relationship makes operational sense. Don't assign a ratio merely because you can calculate one.
Your mental model: repeat a defensible relationship, then challenge the assumption. You're making a working hypothesis, not discovering a law.
Three Jobs the Method Does Well for Early Stage Brands
I'd use this approach when I need a quick estimate that I can explain without walking someone through a maze of formulas. Keep each use distinct, because you'll make different decisions from each output.
Set a marketing starting point
Choose a proposed marketing percentage and multiply it by forecast net sales. Treat the resulting amount as a candidate budget, then decide what you can accomplish with it.
Define the line before you discuss the percentage. If you call it paid advertising, include paid advertising. If you call it marketing, account for the research, sales support, subscriptions, training, and travel you intend to fund.
That distinction matters because you can't compare budgets consistently when you keep changing what they contain. BizMove's marketing-budget guidance discusses both the broader marketing cost base and the backward-looking problem with budgeting promotion from sales.
My recommendation: keep paid media visible as its own row, then show the rest of marketing separately. You should be able to answer what you're buying before you debate whether you're spending enough.
Estimate bad-debt expense
If you record $1,000,000 in relevant sales and expect 1% to go uncollected, you calculate $10,000 in bad-debt expense; under this approach, you focus on current-period sales rather than using the existing allowance balance to determine the expense adjustment, as Lumen Learning explains.
Choose the sales base carefully. For example, $1,000,000 in gross credit sales, less $40,000 in returns and allowances and $10,000 in discounts, gives you $950,000 in net credit sales; a 2% loss estimate produces $19,000 in expense, according to Varsity Tutors' bad-debt calculation.
I would keep an aging schedule alongside that estimate. Use it to investigate overdue customers and challenge your loss assumption, rather than substituting an aging-based allowance calculation for a sales-based expense calculation.
Draft a pro forma and expose the funding question
Start with projected revenue, estimate appropriate sales-linked costs, and calculate forecast profit. Then build a separate view of receivables, inventory, payables, and other funding requirements.
Keep fixed commitments and planned purchases outside automatic percentage scaling. You want to see where you need managerial judgment.
Three Founder Uses for the Percent of Sales Method
| Use case | Formula | Typical line item | Output |
|---|---|---|---|
| Marketing budget | Planned sales × chosen spending ratio | Paid advertising | Candidate spending budget |
| Bad-debt estimate | Relevant net sales × expected loss rate | Bad-debt expense | Current-period expense estimate |
| Pro forma forecasting | Projected sales × historical relationship | COGS, receivables, inventory | Draft financial statements and funding estimate |
I'd review the financing question separately from profitability. Ask when customers will pay, when suppliers require payment, and what cash you must commit before you receive revenue.
If a line item moved with sales for a defensible reason, consider a ratio. If it didn't, choose another model.
When the Method Quietly Hurts a Growing Brand
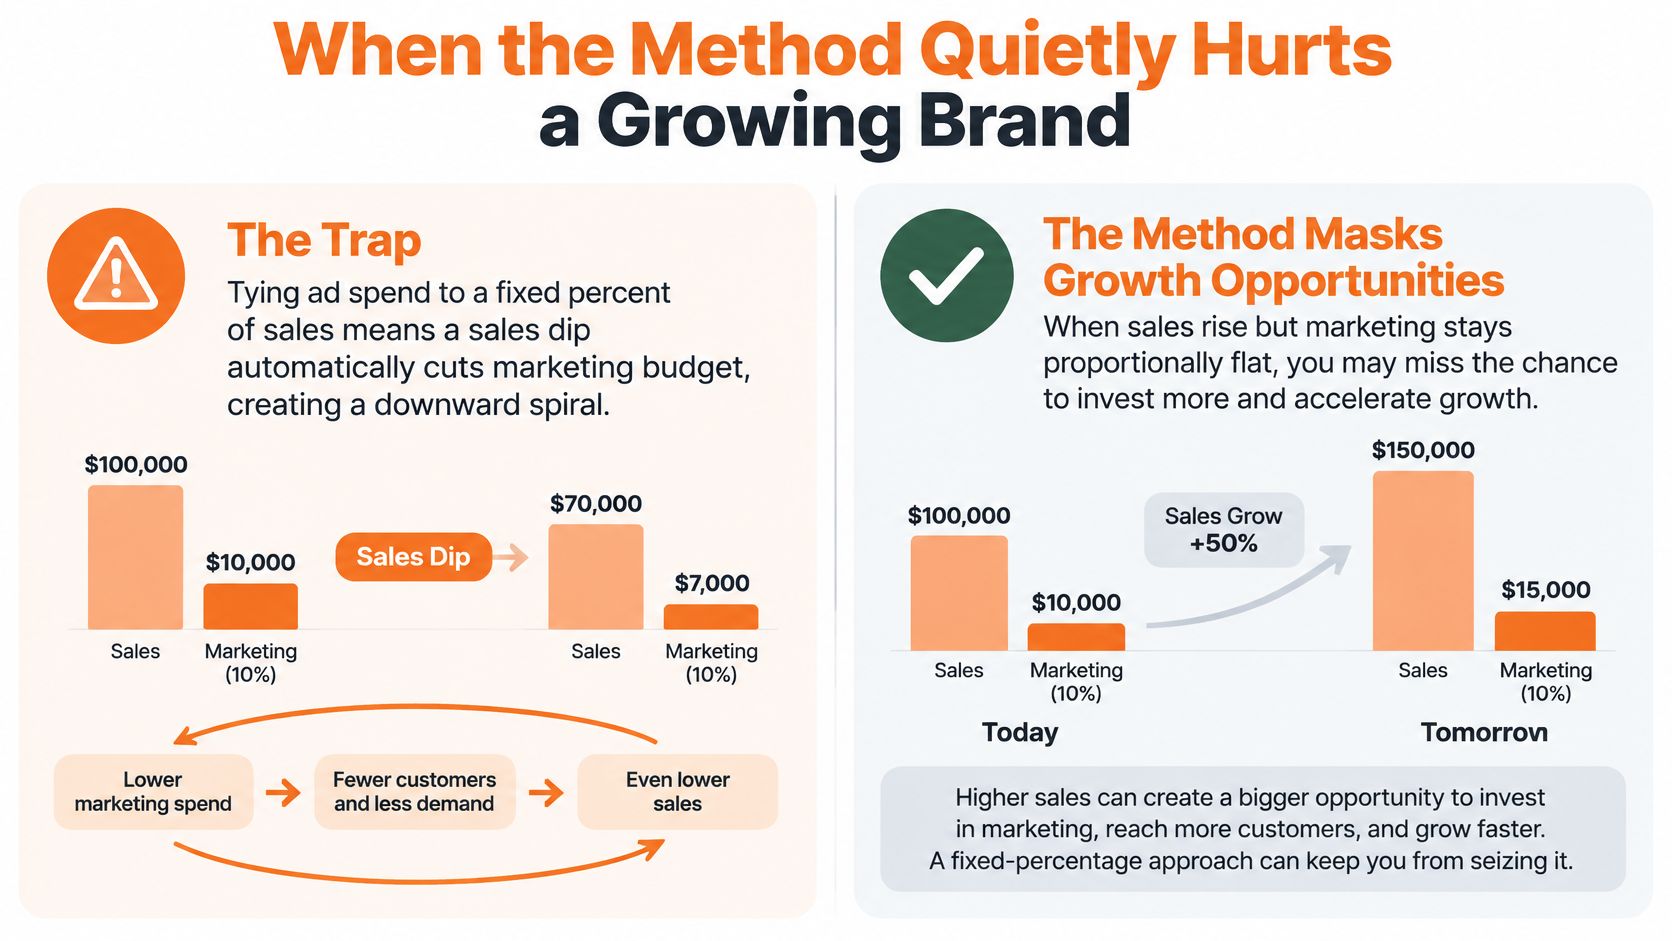
Don't automatically cut marketing because sales fell. If you reduce demand-generating spending solely because revenue dipped, you may make the next period harder.
You can make that mistake while feeling remarkably disciplined. You followed the budget formula, reduced spending, and protected the percentage. But you never asked why customers bought less or whether the campaign still generated worthwhile demand.
The budgeting trap looks like this.
Separate operating spending from investment
I'd divide marketing into an operating floor and an investment budget. That gives you a more deliberate decision than applying a smaller percentage to a disappointing sales month.
- Operating floor: Identify the essential activities you intend to maintain while the business can afford them. Name the activity, owner, and reason.
- Investment budget: Fund a defined goal, like validating a channel or testing demand for a product. Specify what evidence would justify continuing.
- Decision threshold: Set the conditions for expanding, pausing, or stopping before you become emotionally attached to the campaign.
An operating floor isn't permission to ignore cash. Use a small-business cash flow management framework to check what you can sustain before protecting any spending category.
Diagnose the dip before changing the budget
I'd inspect contribution margin, cash runway, customer-acquisition payback, and the test's original success criteria. Then I'd ask whether you lost demand, ran out of stock, changed your prices, or compared an ordinary month with a launch.
If you can't distinguish those explanations, you don't yet have a strong basis for cutting a functioning acquisition channel. You have an investigation to finish.
Budget discipline: Cut spending because you understand its economics, not because you're uncomfortable with a lower revenue number.
Treat early sales history with suspicion when you've relied on founder-led selling, promotions, launches, or unusual attention. You can calculate a perfectly accurate ratio from a period you should never repeat.
The opposite mistake matters too: don't increase every marketing expense because sales rose. Require a purpose for additional spending, and check whether you can execute the plan before allocating the cash.
Driver Based Forecasting and Other Useful Alternatives
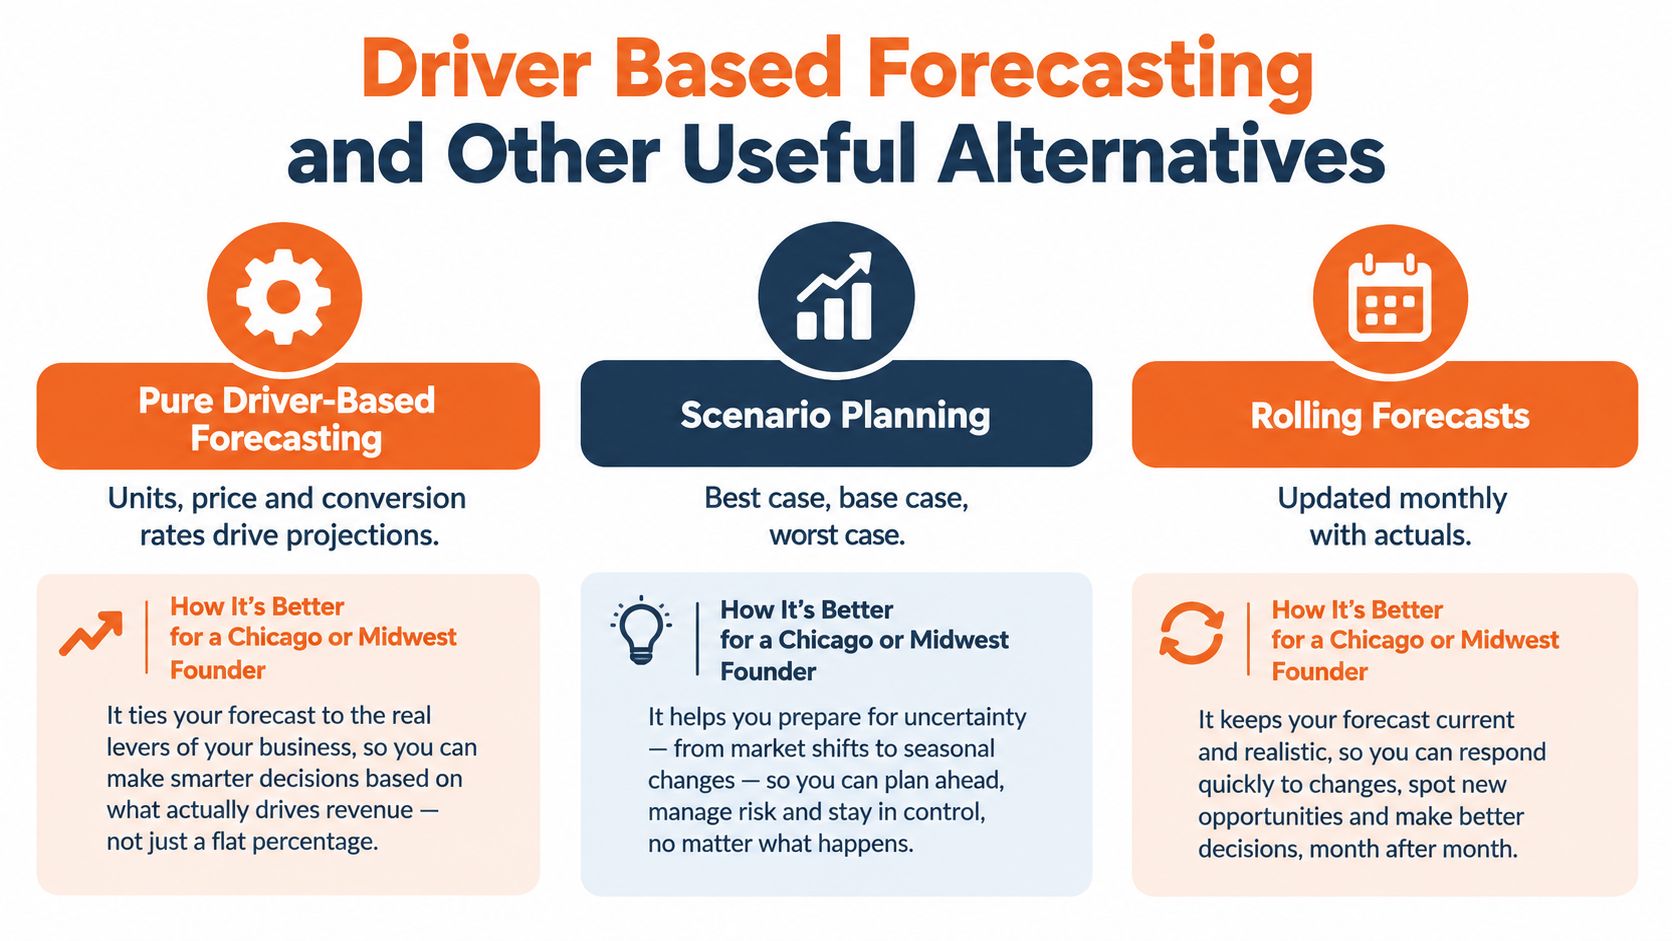
Choose your forecasting method around the decision you need to make. I'd use a sales ratio for a quick first draft, then spend more effort where timing, capacity, or purchasing commitments could change the answer.
These alternatives give you different ways to inspect your assumptions.
Match the model to the decision
| Approach | When I'd choose it | What I'd check |
|---|---|---|
| Percent of sales | Quick planning draft or investor update | Whether the historical relationship still makes sense |
| Driver-based forecasting | Inventory, purchasing, or capacity decisions | Units, lead times, safety stock, and payment timing |
| Rolling or weighted ratios | Uneven recent performance | Which periods deserve weight and why |
| Segmented ratios | Different product or channel economics | Whether you've separated meaningful differences |
| Scenario planning | A decision with uncertain demand | What you'd change under stronger or weaker sales |
For inventory, work from expected units, replenishment lead times, and purchasing constraints. Check receivables against credit sales and collection speed, and check payables against purchases and supplier terms.
You can't expect smooth percentage relationships when you face minimum production runs, warehouse openings, or large seasonal purchases before revenue arrives, as the Northern Virginia Community College financial forecasting material explains. Reconcile the sales-based estimate with those operational commitments.
Make uncertainty visible
Use rolling or weighted averages when you need a more deliberate historical baseline. Document your weighting choice, and don't assume an average will fix a structural change.
For another planning perspective, consult HireAccountants on honest financial forecasting. You can also compare revenue forecasting methods before deciding how much detail your model needs.
Keep a stronger-demand case, an expected case, and a weaker-demand case. Write the action you'd take under each, rather than merely producing different totals.
If you prefer a video alongside your worksheet, use this as a companion.
A Spreadsheet Template You Can Clone Tonight
Open Google Sheets or Excel and create Forecast, Ratios, and Bad Debt tabs. Keep your assumptions separate from your calculations so you can trace a surprising result without clicking through scattered overrides.
Use the layout below as your copyable starting point. You don't need a downloaded file to build it.
Build the Forecast tab
Put projected sales and scenario labels at the top. Flag editable inputs in yellow, protect formula cells, and use these column headers:
| Line item | Current year actual | Current year ratio | Next year projected sales | Next year projected line | Notes |
|---|---|---|---|---|---|
| Net sales | Enter actual | Reference assumption | Link sales input | Link sales input | Explain demand |
| COGS | Enter actual | Link Ratios tab | Link sales input | Sales × ratio | Explain purchasing |
| Gross profit | Calculate | Calculate | Leave blank | Sales less COGS | Check margin |
| Marketing | Enter actual | Link Ratios tab | Link sales input | Use approved budget | Separate spending types |
| Operating expenses | Enter actual | Link where appropriate | Link sales input | Ratio or direct input | Identify fixed commitments |
| Bad-debt expense | Enter actual | Link Bad Debt tab | Link relevant sales | Relevant sales × loss rate | Explain collection basis |
| Operating profit | Calculate | Calculate | Leave blank | Gross profit less expenses | Review assumptions |
Below the income statement, add a separate working-capital schedule. Don't mix asset balances with expenses just because you express both as percentages.
Keep assumptions inspectable
On the Ratios tab, give each assumption its own cell, historical basis, owner, and review note. For ecommerce, calculate ratios by product category, channel, and month rather than relying on an annual blended percentage, using the segmentation approach discussed earlier.
Add these guardrails:
- Expense check: Sum comparable expense ratios and flag results outside your intended profitability range. Exclude subtotals to avoid double counting.
- Same-revenue reconciliation: Run the forecast at the historical revenue level and explain differences from actual results.
- Collection check: Keep aging buckets, write-offs, and loss assumptions on the Bad Debt tab so you can investigate discrepancies.
Use this visual as a pause point before your final worksheet check.

Before you share the file with an investor or bookkeeper, save a version with the date and scenario name. Keep an untouched copy so you can reconstruct what you believed at the time.
The One Habit That Keeps the Method Honest
Schedule a quarterly assumption review. Compare each assumed ratio with your recent actual relationship, and write a plain-English explanation for material differences.
Use a consistent process to analyze sales data before changing assumptions. Don't overwrite an uncomfortable variance until you understand it.
- Protect formulas: Keep accidental edits out of calculation cells.
- Version the file: Preserve the assumptions behind each shared forecast.
- Compare actuals with plan: Investigate the operating reason for differences.
- Refresh collection assumptions: Review aging data and actual write-offs.
- Review marketing deliberately: Keep operating needs separate from investment decisions.
Your job isn't to defend last quarter's percentage. Treat the percent sales method as a fast first draft, then use your numbers, your channels, and your judgment to rewrite it.
Chicago Brandstarters is a free, vetted community for kind, hard-working Chicago and Midwest founders, with private dinners and a group chat for honest operating conversations. Visit Chicago Brandstarters if you want founder peers to talk through the assumptions behind your budget, including the spending decisions you're reluctant to make alone.
Leave a Reply