

You've spent the week replying to every lead, jumping between demos, fixing product issues, and chasing prospects who may never buy. Your CRM looks busy, yet your revenue still depends on a small group of accounts you can probably name from memory. The 80/20 rule in sales gives you a practical way to find that group, then decide whether your calendar and workflow let you reach it.
The rule isn't a promise that every business will produce a perfect 80/20 split. It's a sorting method. You compare customers, products, channels, reps, and activities by their contribution, then put more attention where the return is highest. The harder part comes after the spreadsheet: you need a process that protects time for those accounts.
The 20% That Quietly Runs Your Sales
A bootstrapped SaaS founder once described his pipeline to me as “healthy” because it contained hundreds of leads. After months of chasing every opportunity, he exported his customer data and sorted accounts by revenue. A small group of customers carried enough revenue to cover half the company's payroll. The rest created activity, questions, and follow-up work, but they didn't carry the same financial weight.
That moment changes how founders read a CRM. Early on, every lead feels equally important because each one might become the first big win. Later, a revenue chart usually tells a different story. A long tail of small accounts occupies the pipeline, while a compact cluster drives most closed revenue, renewals, and expansion conversations.
The historical pattern traces back to Vilfredo Pareto, who observed that about 80% of Italy's land belonged to 20% of the population in 1896. Management consultant Joseph M. Juran later turned the observation into a business framework for separating the vital few from the trivial many. The history of the Pareto principle helps explain why sales teams use the rule as a lens rather than a guarantee.
What the first export usually reveals
A founder's first instinct often says, “I need more leads.” A revenue-ranked export asks a sharper question: “Which accounts already prove that my offer works?”
| Customer Cohort | % of Accounts | % of Revenue | Time Spent On |
|---|---|---|---|
| Highest-value accounts | About 20% | About 80% | Focused retention, expansion, and executive attention |
| Remaining accounts | About 80% | About 20% | Scaled support, qualification, and selective follow-up |
These proportions describe the commonly cited sales pattern, where roughly 20% of customers generate about 80% of revenue. Salesforce's explanation of the 80/20 rule recommends sorting customer revenue and finding where cumulative revenue reaches the 80% threshold. Your actual split may differ, and that difference matters more than forcing your data to match the slogan.
I look at the split through three lenses. Customers show who deserves retention and expansion time. Products show which offers carry the commercial engine. Prospecting channels show where qualified opportunities originate. Reps, deal stages, and objections can reveal the same concentration.
If you need help turning raw account data into a usable sales process, start with a sales data analysis guide and document the assumptions behind each report. Then decide whether your team needs more capacity, including specialist closers for opportunities that already meet your qualification standard. The math becomes useful only when somebody acts on it.
Where the 80/20 Rule Actually Comes From
The original observation came from economics, not sales. In 1896, Italian economist Vilfredo Pareto examined land ownership and found that about 20% of the population owned about 80% of Italy's land. Pareto described a pattern in distribution. He didn't create a sales playbook or claim that every system follows one exact ratio.
Joseph M. Juran carried the idea into quality management. He used the distinction between the vital few and the trivial many to help managers focus on the smaller number of causes that created most defects or problems. That translation mattered because it turned an observation into a prioritization habit that people could apply across departments.
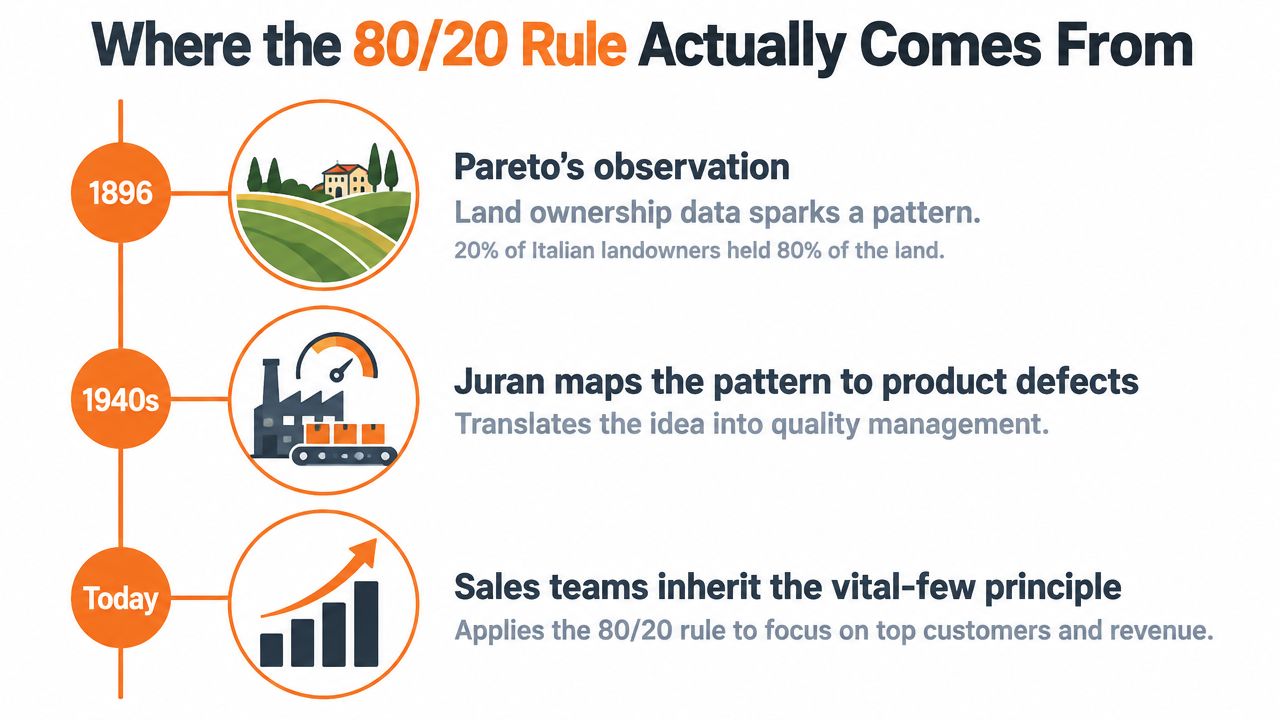
What changed when sales adopted it
Sales leaders applied the principle to customers, products, territories, and salespeople. The question shifted from “What is the average account worth?” to “Which accounts create most of the result, and what do they share?”
That shift also explains why the rule appears in marketing, product planning, time management, and quality work. Juran borrowed a pattern from one discipline and made it useful in another. Sales teams could now test concentration in their own data instead of relying on an average that hid outliers.
The ratio rarely lands cleanly. You might see 70/30, 90/10, or another distribution, as the practical sales discussion from Atlassian explains. Treat 80/20 as a starting lens. If your top accounts produce much more than 80% of revenue, concentration risk may deserve attention. If the distribution looks flatter, you may need broader coverage or stronger segmentation.
Practical rule: Use the ratio to decide what to inspect first. Use your own revenue, margin, retention, and effort data to decide what to do next.
Sorting Customers to Find the Vital Few
You can run the first analysis this afternoon with a CRM export and a spreadsheet. The quality of the result depends less on the chart than on the definitions you choose before sorting.
Build a clean revenue table
Export closed-won account data for the last 6–12 months, then include the account name, revenue, product, lead source, sales rep, and customer status. The University of Maryland's guide to applying the Pareto principle recommends sorting accounts by revenue and calculating cumulative revenue share to identify the smallest group that crosses the 80% threshold.
Use one consistent revenue definition. Mixing recurring revenue with one-time fees can make a project-heavy account look stronger than it is. Remove churned logos from a current-customer analysis, or label them separately if you're studying historical acquisition. Check quarterly enterprise invoices for duplicate rows before you calculate totals.
Rank, accumulate, and test the cutoff
Sort accounts from highest to lowest revenue. Add a cumulative revenue column, then divide each running total by total revenue. The first row where cumulative share reaches or crosses 80% marks the approximate size of your vital few.
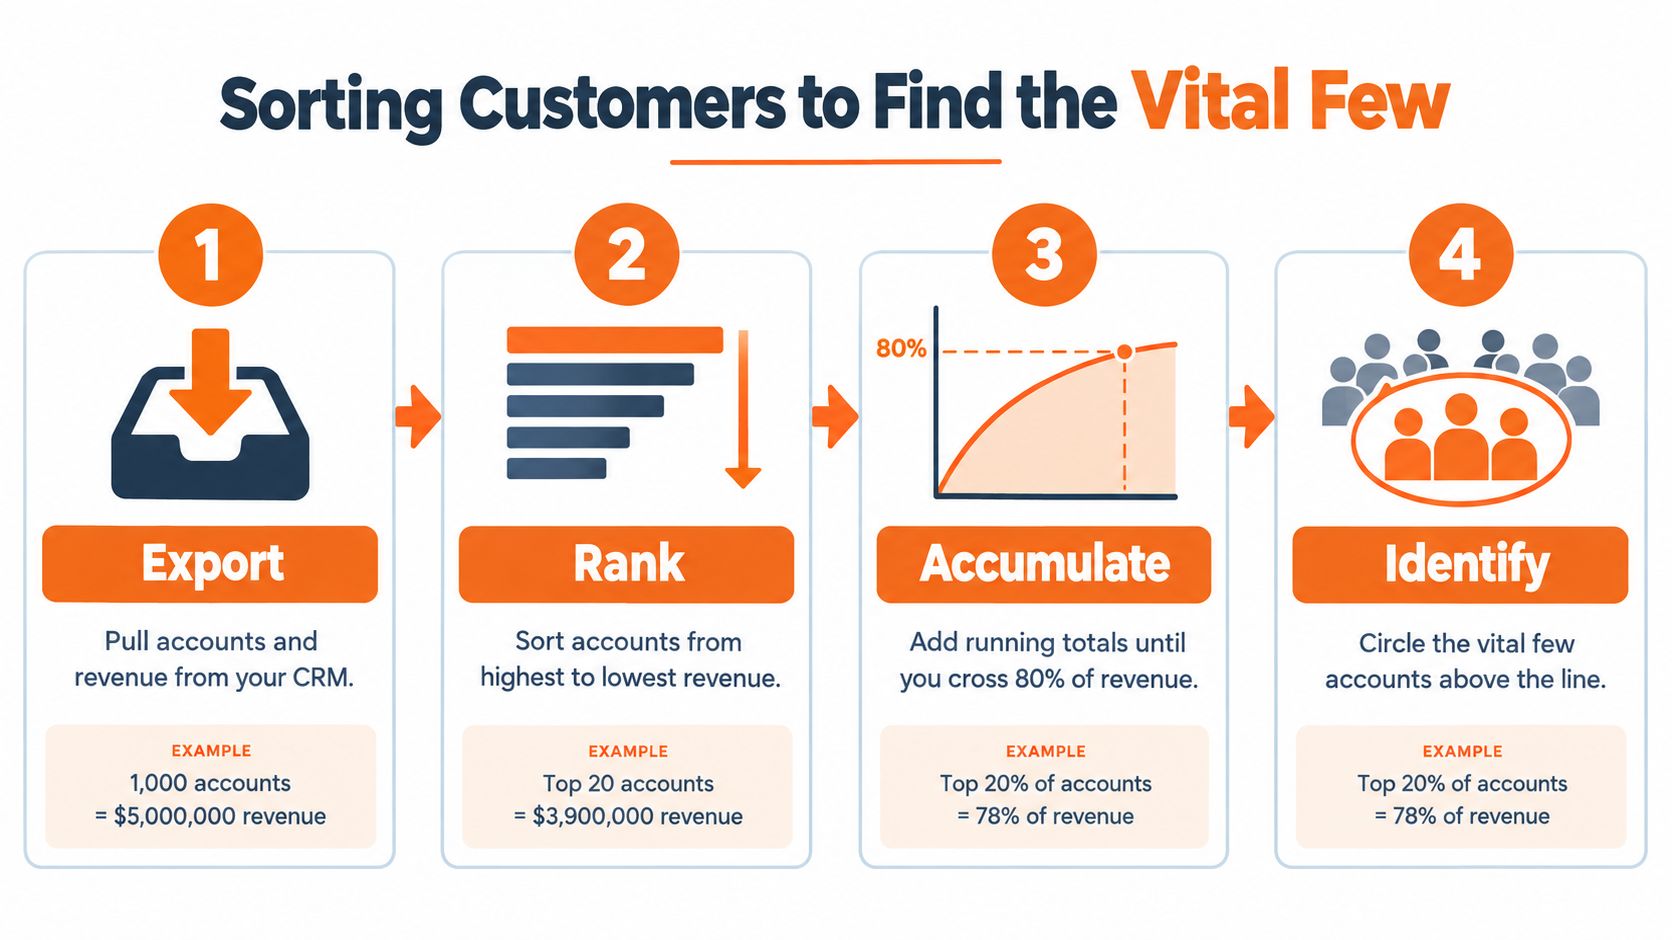
The calculation answers “who produces the revenue?” It doesn't answer “who deserves every available hour?” Add revenue per hour of attention. A moderate account that needs two concise emails each quarter may produce a better return on your time than a larger account that requires constant custom work, escalation, and executive involvement.
A practical sheet should contain:
- Account identity: Name, segment, owner, and current status.
- Commercial output: Revenue, recurring revenue where relevant, gross margin if available, and renewal or expansion history.
- Attention cost: Estimated selling, support, implementation, and executive hours.
- Origin: Lead source, campaign, partner, or referral path.
- Tier decision: Vital few, platinum, managed, automated, or disqualified.
- Next move: Retain, expand, refer, automate, investigate, or exit.
Create a platinum tier
The top group often contains its own concentration. Reapply the same sort inside the vital few and create a smaller platinum tier for accounts that combine revenue with fit, retention, margin, and manageable service needs. Give those accounts deliberate renewal planning, senior outreach, and expansion research.
Account-based campaigns can help when several stakeholders matter inside one target company. For a practical guide to planning that motion, review The Social Search's ABM campaign guide. Pair the account list with a clear target audience definition so your team knows why an account belongs in the tier.
Use the embedded walkthrough as a companion while you build the sheet:
Beyond Customers, Products, Channels, and Reps
Customer concentration is only the first use of the 80/20 rule in sales. Once you sort one dimension, repeat the same move across the parts of your pipeline that consume time or produce outcomes.
A product analysis starts with units sold, revenue, and gross margin by SKU or package. A high-revenue offer may carry weak margin or require extensive onboarding. A lower-priced tier may create more repeatable sales with less service work. Sort products by commercial contribution, then compare that result with the effort each product demands.
Prospecting channels need a different view. Raw lead volume can make a channel look productive even when few leads become qualified meetings. Sort sources by qualified meetings, opportunities, and closed revenue. A small number of sources, such as partner referrals, inbound demos, or one outbound sequence, may produce most of the sales conversations worth pursuing.
Rep analysis requires care. Sales references commonly apply the rule to the team itself, with about 20% of salespeople producing 80% of sales revenue according to Firstsales' sales glossary. Don't use that pattern to label people permanently. Use it to inspect territory quality, lead distribution, ramp support, deal mix, and coaching needs.
Four ways to sort the pipeline
| Dimension | What to Sort By | Typical 80/20 Pattern | Action to Take |
|---|---|---|---|
| Products | Revenue, units, and gross margin | A small product group may produce most profit | Protect availability, refine positioning, and test expansion |
| Prospecting channels | Qualified meetings and closed revenue | A small source group may produce most viable opportunities | Shift attention toward high-fit sources |
| Sales reps | Closed revenue, margin, and cycle quality | A smaller rep group may carry most output | Study behavior, territory, and support conditions |
| Objections and stages | Lost deals by stage and reason | A few stalls may account for many missed wins | Fix messaging, qualification, or next-step discipline |
Product mix analysis has a clear precedent. Simply Psychology's overview of the Pareto principle notes that about 80% of profits can come from 20% of products or services. Treat that as a prompt to check your own margin data, not as a conclusion about your catalog.
The same sorting logic applies to objection handling. Group lost opportunities by the last meaningful objection or stalled stage. If a small set appears repeatedly, build better discovery questions, proof points, or qualification rules around those issues. When your team needs more outbound capacity, resources to hire cold callers may help, provided you give them a defined account profile and a measurable handoff standard.
Why Even the Right 20% Is Out of Reach
A founder can identify the accounts most likely to renew, expand, or refer, then lose the afternoon to support requests and CRM cleanup. The analysis creates clarity, but an overloaded calendar decides where attention goes.
Bain's 2025 report says sellers may spend only about 25% of their time selling. That figure points to an operational problem: high-value accounts can remain untouched while low-value work fills the day. Bain's report on AI, productivity, and sales connects that time constraint with the need to redesign sales work.
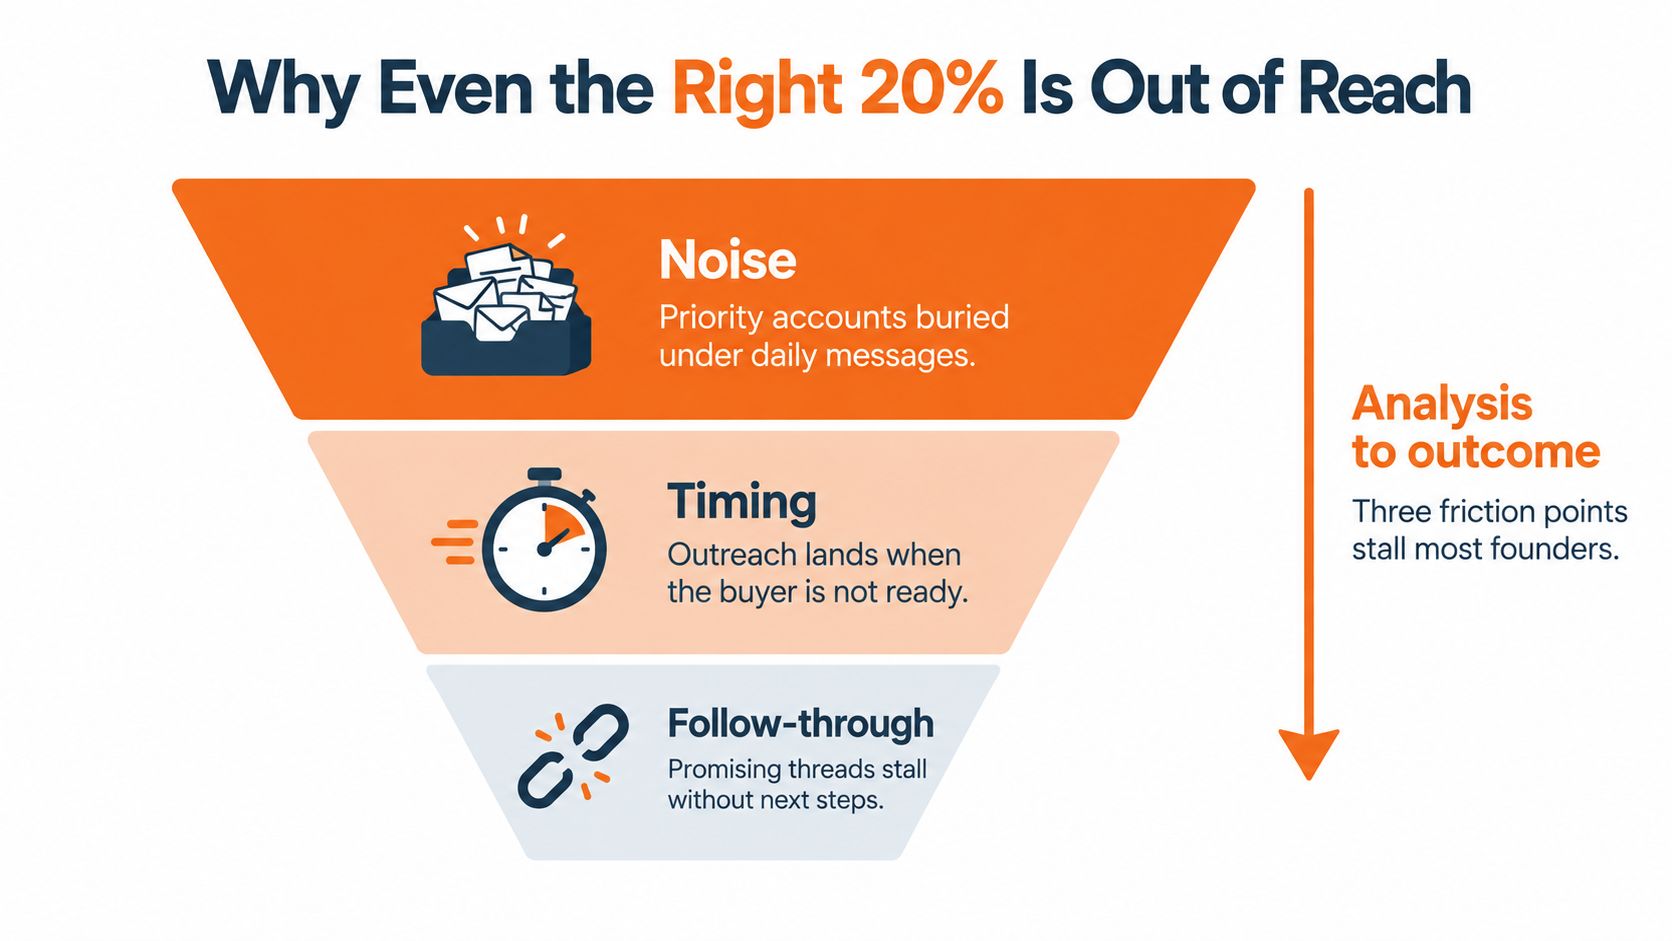
Three frictions block the handoff from insight to action
Noise pushes priority accounts below inbox messages, support requests, internal questions, and low-fit leads. If the CRM does not surface the next action for a platinum account, that account competes with every other task.
Timing weakens outreach when the message lacks context. Before contacting a buyer, you may need to review tickets, product usage, stakeholders, renewal dates, and previous objections. Manual preparation can consume the time reserved for the conversation.
Follow-through fails after the first touch. High-value opportunities often require coordinated steps. Momentum disappears when the next action is unclear, the CRM remains outdated, or a promising thread sits idle.
AI and workflow automation can reduce this drag when applied to defined tasks. Use AI to draft a call brief from CRM notes, summarize a meeting, suggest a next step, or surface dormant threads. ZoomInfo's 2025 survey says frequent AI users save an average of 12 hours per week, while G2 reports a 49% productivity increase among many mid-market and enterprise users. The Bain report cited earlier provides surrounding context for treating those figures as reported findings, not universal outcomes.
The practical test is simple: reserve time for priority accounts, then remove the preparation and follow-up work that repeatedly steals it.
The 80/20 analysis tells you where to look. Your workflow decides whether you arrive there.
A Simple Prioritization Framework for Founders
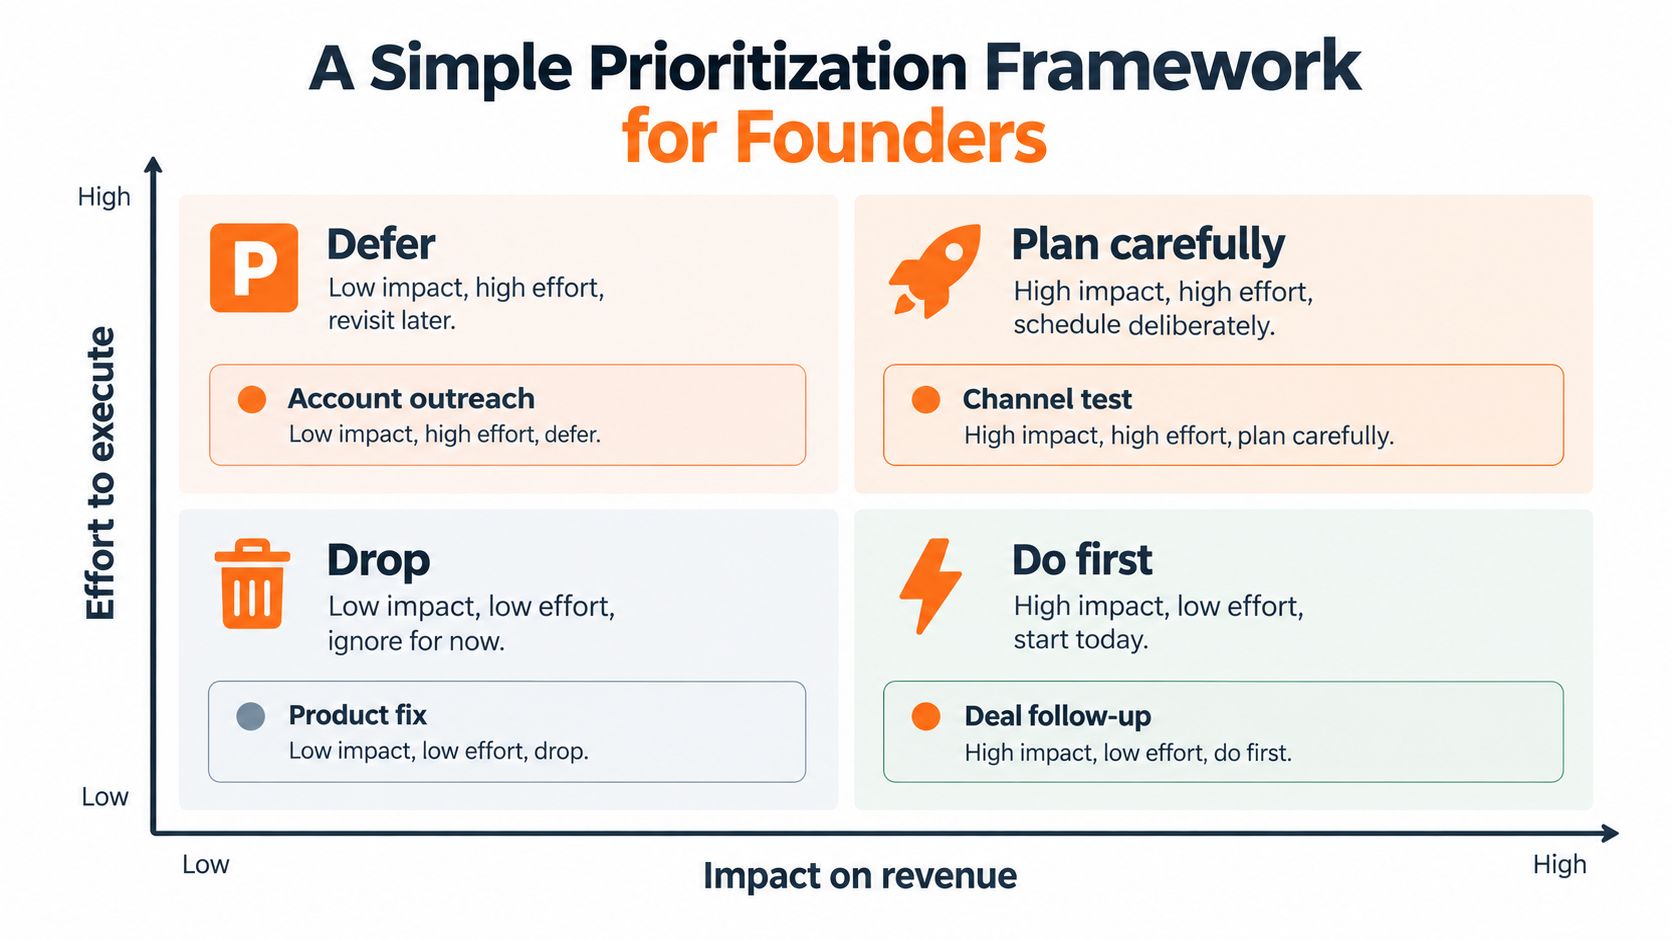
A two-axis matrix makes the analysis usable during a busy week. Put impact on revenue on one axis and effort to execute on the other. Then place every candidate action on the grid, from a platinum-account follow-up to a product fix or channel test.
High-impact, low-effort work goes first. That might mean sending a personalised renewal note, confirming a next meeting, or asking a satisfied customer for a referral. High-impact, high-effort work needs a deliberate plan, such as researching several stakeholders or building a bespoke proposal.
Low-impact, low-effort work belongs in maintenance blocks. Low-impact, high-effort work deserves a serious challenge before you commit.
Use time tiers instead of equal coverage
A simple operating split gives the matrix a calendar. Spend 70% of selling time on accounts in your top decile, 20% on the next tier, and 10% on new logos. This is a working rule for founders who need to protect existing commercial value while keeping new business alive, not a law that fits every sales motion.
Effort-light actions include templated outreach, scheduled prospecting blocks, and AI-drafted call briefs. Effort-heavy actions include custom research, multi-stakeholder dinners, and bespoke decks. Choose the light version when the account already has fit and a clear next step. Choose the heavy version when the revenue at stake and buying complexity justify the time.
The matrix also helps you refuse attractive distractions. A product fix may feel urgent because somebody requested it, while a short follow-up could move a live deal forward. A channel test may sound strategic, while your current best source still has unworked accounts.
For a broader decision process that helps founders compare trade-offs, use this framework for making decisions. Keep the grid current. A stale prioritization system becomes another administrative task rather than a filter for action.
Your First 30 Days With the 80/20 Rule
Start with a clean export, not a new sales tool. By the end of the second week, you should have a sorted customer list, a platinum tier marked in your CRM, and three product lines identified as revenue drivers. Keep the first pass simple enough that you can explain every row.
A month-long operating plan
Week one, prepare the data. Define revenue, status, time cost, and account ownership. Export closed-won data, remove duplicates, separate recurring and one-time revenue, and record the assumptions in the sheet.
Week two, assign tiers. Sort accounts from highest to lowest revenue. Mark the smallest group that crosses the 80% threshold, then review fit, margin, retention, and service effort before you create the platinum tier.
Week three, redirect activity. Review prospecting sources by qualified outcomes. Move effort toward the channels that produce your strongest opportunities, and ask reps to drop or automate their lowest-yield activities.
Week four, install the ritual. Reserve a one-hour monthly review. Recompute the split, retire accounts that fell out of the vital few, and inspect new entrants before they disappear into the long tail.
Printable checklist
- Export: Pull recent account, revenue, product, source, rep, and status data.
- Clean: Remove duplicate contracts, separate fee types, and label churned accounts.
- Sort: Rank accounts by revenue and calculate cumulative share.
- Segment: Mark the vital few, then create a platinum tier based on revenue and efficiency.
- Review channels: Compare qualified meetings, opportunities, and closed revenue by source.
- Audit time: Record where selling hours go and compare effort with account value.
- Choose actions: Schedule retention, expansion, follow-up, automation, or exit decisions.
- Recalculate: Repeat the analysis on a fixed monthly cadence.
The discipline that protects the system is repetition. Your vital 20% will change as customers churn, products mature, channels shift, and new accounts expand. Re-run the analysis often enough to keep your calendar connected to current evidence.
Chicago Brandstarters gives founders a free, vetted community for practical conversations, private small-group dinners, and peer support while they build from idea stage toward seven figures. If you want candid feedback on your sales priorities and a stronger founder network in Chicago or the Midwest, visit Chicago Brandstarters and explore the community.
Leave a Reply