
You bought inventory with real money. Now it's sitting in boxes, eating cash and making you second-guess every decision.
I know that feeling. You look at the warehouse shelf, or the back room, or the Shopify stock count, and you don't just see products. You see delayed ad spend, delayed payroll, delayed product development, delayed momentum. Unsold stock turns into mental clutter fast.
That's where sell through rate helps. I don't treat it like a vanity metric. I treat it like a flashlight. It helps me see where demand is real, where inventory is misplaced, and where I'm telling myself the wrong story about what's actually going on.
That Pile of Unsold Stuff in Your Warehouse
A founder in my orbit once had the classic problem. Sales weren't dead. The brand had orders coming in every week. But the warehouse still had stacks of product that should've moved by now. On paper, the business looked fine. In reality, cash was stuck.
That's the trap. Most operators look at top-line sales and feel either relief or panic. Neither reaction is that useful. You need a cleaner question: how much of what you brought in are you selling through?
Why this metric matters when your gut is lying to you
Your gut will blame the product. Sometimes that's right. A lot of the time, it isn't.
Maybe one color is dragging down the whole style. Maybe your retail partner moves it well, but your site doesn't. Maybe demand is healthy in one region and soft in another. A blended view hides all of that. If you want a practical primer on the metric itself, I like resources that Drive profits with inventory decisions because they push you toward action instead of trivia.
You don't fix inventory by staring harder at the total stock number. You fix it by asking sharper questions.
The real use of sell through rate
I use sell through rate to make decisions about three things:
- Buying: Did I bring in too much, too little, or the wrong mix?
- Merchandising: Does this item need better placement, bundling, or a cleaner story?
- Cash timing: Should I hold, reorder, transfer, or mark it down?
If inventory is the water in your pipes, sell through rate tells you where it's flowing and where it's clogged. That's the point. You're not tracking a number to seem smart. You're trying to get cash moving again.
What Sell Through Rate Actually Tells You
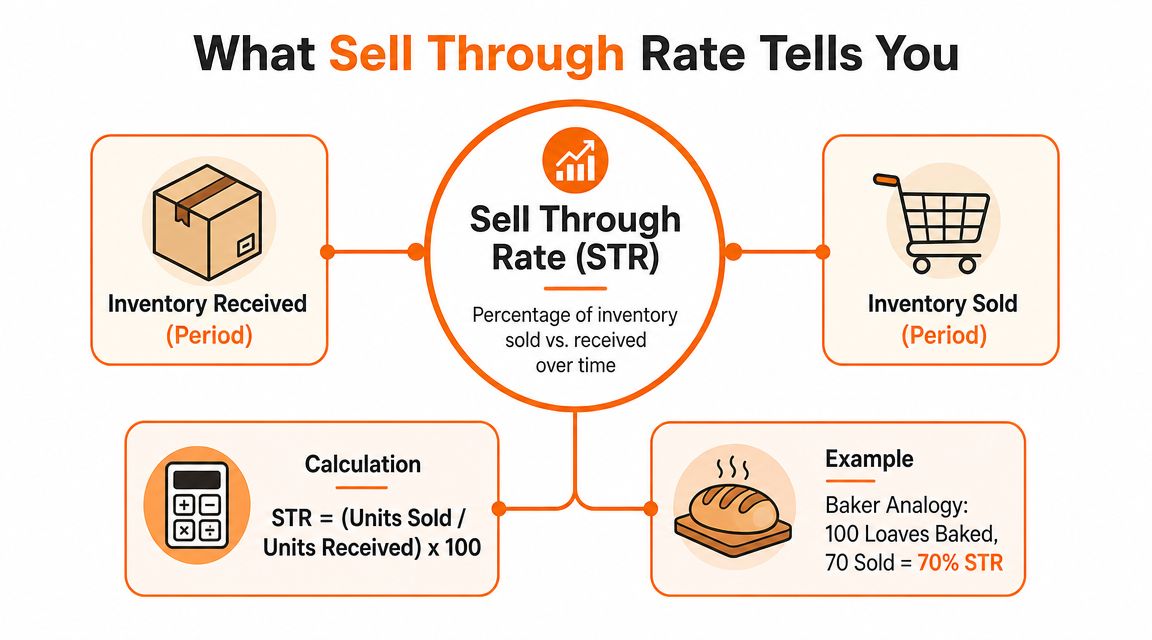
Sell through rate is the share of inventory sold during a set period compared with the inventory received in that same period.
That's it. Simple idea. Useful metric.
A bakery is the easiest analogy. If you bake loaves in the morning and most of them are gone by the end of the day, you know demand matched what you produced. If the trays are still full at closing, something is off. The same logic applies to shirts, candles, supplements, coffee gear, or any other product you sell.
The formula
Use this:
Sell through rate = (Units sold / Units received) x 100
Here's a simple example. You receive a batch of inventory for a product. During the period you're measuring, you sell part of that batch. Divide the units sold by the units received, then multiply by 100 to express it as a percentage.
That math matters less than the habit. You need a repeatable way to compare products, periods, and channels. If you already track adjacent inventory metrics, this guide to inventory turnover formula pairs well with sell through rate because the two metrics answer different questions about movement and efficiency.
What it tells you and what it doesn't
Sell through rate tells you how fast inventory is leaving relative to what came in. It is a demand-versus-supply signal. It helps you see whether your buy matched actual customer behavior.
It does not tell you everything on its own.
A weak rate might point to bad pricing, weak merchandising, poor traffic quality, bad timing, too much inventory, or inventory sent to the wrong place. A strong rate might mean demand is great, or it might mean you bought too conservatively and stocked out early. If you want a broader KPI mindset that helps turn e-commerce data into action, think of sell through rate as one operating signal among several, not a magic dashboard score.
Practical rule: Measure sell through rate on a fixed cadence. Same window, same logic, same SKU definitions. If the setup changes every time, the metric turns into noise.
A quick gut check
Ask yourself these questions when you look at the number:
| Question | Why I ask it |
|---|---|
| Did I receive too much inventory for this period? | Overbuying can make decent sales look weak |
| Did I receive the right mix? | A good product can still have the wrong size or color balance |
| Did I support the launch properly? | Poor creative or placement can drag an item down |
| Did I measure the right time window? | Seasonal items need context |
Sell through rate is basic math. Interpreting it well is where the operator skill comes in.
Good vs Bad Sell Through Rate Is a Myth
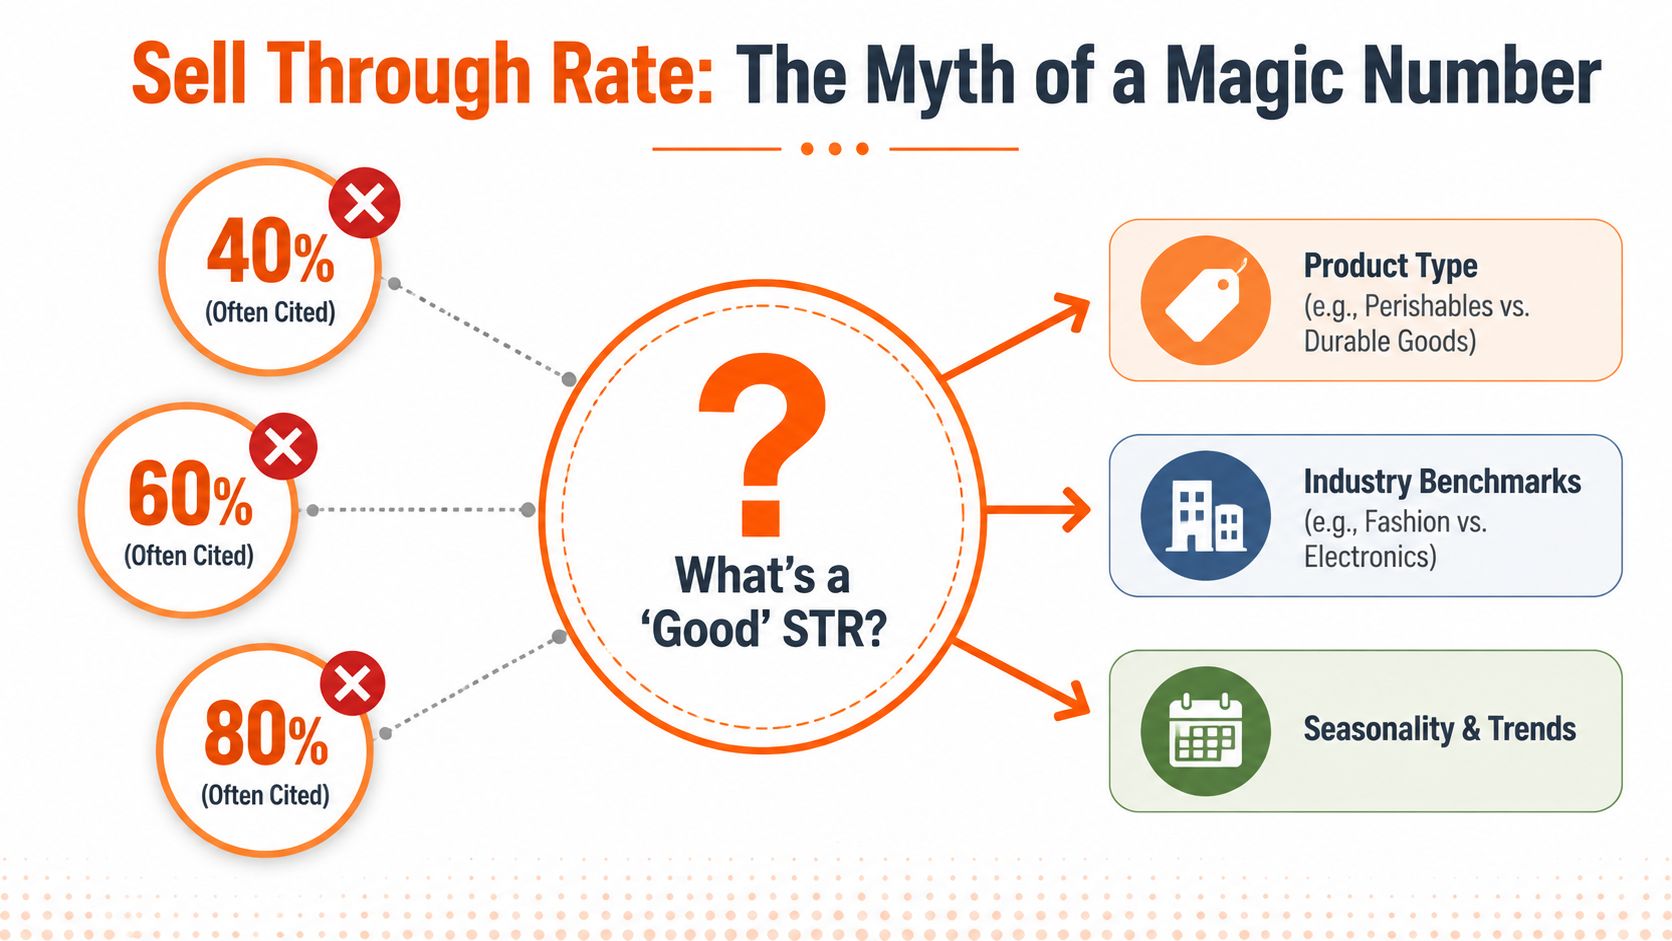
Founders love to ask for the “right” sell through rate. I get it. A single target feels comforting. You want someone to tell you what number means you're winning.
That shortcut usually makes things worse.
Different advice online throws around 40%, 60 to 80%, 75%, and even 80% as healthy benchmarks. That inconsistency is one reason I don't trust benchmark-first thinking. As noted by Lightspeed, those thresholds vary widely, and a very strong sell through rate can also signal underbuying or understocking, while a lower rate can be fine in categories with longer selling cycles or intentional assortment breadth (Lightspeed).
Why benchmark chasing backfires
A high sell through rate feels good because it looks efficient. But if you sell out too fast, you may have guessed too low on demand. That means missed revenue, frustrated customers, and broken momentum.
A lower rate can be completely rational. Some products need longer consideration. Some categories work better with broader choice. Some brands intentionally carry depth in one area and width in another.
If you only ask whether your sell through rate is high, you'll miss the better question. Did your inventory strategy fit the job?
Context changes the answer
I judge sell through rate based on the situation around it.
Consider these comparisons:
| Situation | How I read the number |
|---|---|
| New product launch | I care about early traction, customer response, and whether the story landed |
| Evergreen staple | I care about steady movement and replenishment rhythm |
| Seasonal item | I care about timing, urgency, and exit plan before the season ends |
| Broad assortment strategy | I accept slower movement on some items if the mix supports conversion overall |
If you run a fast-moving trend business, your tolerance for lag is low. If you sell products with a longer shelf life and more deliberate buying cycles, slower movement isn't automatically a problem.
Build your own baseline
I'd rather you create your own internal standard than borrow one from a random blog post.
Start with a few questions:
- What is this product supposed to do? A hero SKU and a supporting SKU should not be judged the same way.
- How long do I expect it to sell? A holiday bundle and a year-round replenishment item need different expectations.
- What happened around the launch? Promo timing, channel mix, and stock timing change the story.
Your baseline gets better over time. That's normal. You're not trying to find a universal law. You're building judgment.
How STR Impacts Your Cash and Your Sanity
Low sell through rate is a cash problem before it becomes a storage problem.
When product sits, money sits with it. You can't use that cash for paid ads, a reorder on your winner, packaging improvements, or the founder salary you keep pushing off. You start telling yourself the business is growing because inventory keeps arriving, when what's really happening is that cash is hardening into boxes.
Slow inventory creates expensive decisions
Holding inventory has a cost. Storage, handling, insurance, attention, and markdown pressure all pile up. If you want a deeper look at those costs, this breakdown of inventory carrying cost is worth reading.
The emotional cost is real too. Slow stock makes every buying decision feel personal. You hesitate on reorders because the last batch still hasn't cleared. You avoid your own numbers because you already know where the pain is.
Unsold inventory doesn't just take space in your warehouse. It takes space in your head.
Healthy movement gives you options
A healthy sell through rate changes the feel of the business. Cash comes back faster. You can place smarter reorders. You can test new products without betting the whole quarter on one buy. You stop running desperate promos and start making planned decisions.
I've seen founders obsess over margin while ignoring movement. That's backwards. Margin matters, but inventory that never converts is fake profit on paper. Movement creates oxygen.
Here's the blunt version:
- Low sell through rate traps cash and forces ugly choices later.
- Healthy sell through rate gives you flexibility.
- Overly high sell through rate can mean you bought too little and capped your upside.
That's why I care about this metric. It affects what you can do next week, not just what your spreadsheet says about last month.
Smart Ways to Improve Your Sell Through Rate
If your sell through rate is weak, don't start with a discount code. Start with diagnosis.
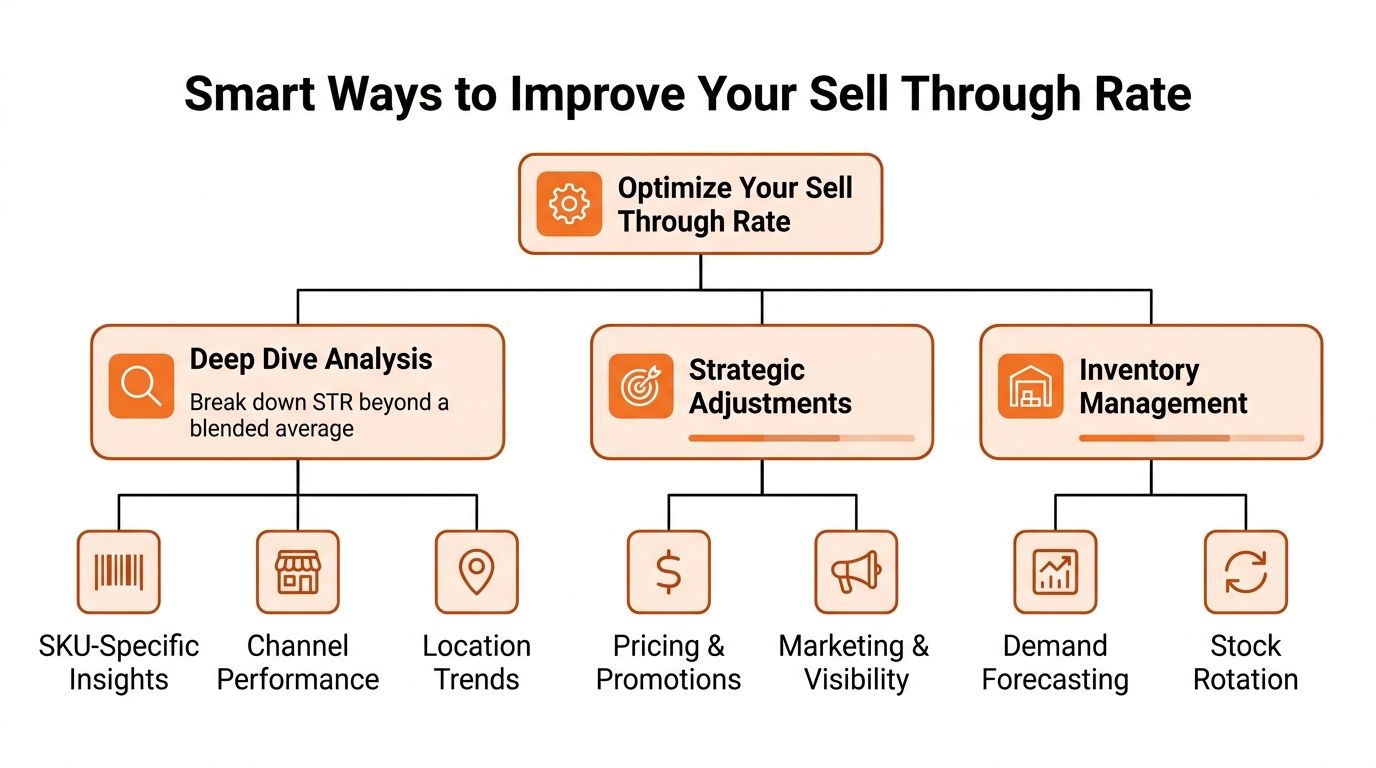
The biggest mistake I see is treating one blended business-wide number like it means something useful. It usually doesn't. Toolio makes this point well: the most useful application of sell through rate is as a diagnostic tool when broken down by SKU, channel, or geography, because that helps you tell the difference between weak demand and inventory misallocation, and it supports faster replenishment and markdown decisions (Toolio).
Break the number apart
Start by slicing the metric. Don't stop at the total.
Look at:
- SKU level: One variant can sink the average for the whole style.
- Channel level: Shopify, wholesale, marketplace, and pop-up performance can tell very different stories.
- Location level: One region may want the product more than another.
Founders usually find the core problem here. Demand might be fine. Allocation might be bad.
Match the fix to the cause
Once you know where the drag is, pull the right lever.
Pricing
If one SKU keeps lagging while comparable items move, test pricing or timing. I don't mean panic and slash everything. I mean make a deliberate call. A targeted markdown can free cash and teach you whether the issue is price resistance or lack of interest.
Merchandising
Sometimes the product is fine and the presentation is lazy. Move the item higher on your collection page. Change the first image. Pair it with a better seller. Build a bundle that gives the customer a clearer reason to buy now.
Marketing
Weak sell through can come from weak attention. Give the product its own email. Put it in a paid social test with a sharper angle. Rewrite the product page headline so it answers the buyer's first question faster.
Operator note: If traffic is seeing the product and still not buying, fix the product story or the offer. If traffic never reaches the product, fix discovery first.
Allocation and replenishment
This one gets missed all the time. If the item sells in one channel or region and stalls in another, the issue may be placement, not demand. Shift inventory. Don't keep feeding the wrong lane.
A lot of practical inventory discipline comes down to boring habits. Review movement often. Keep simple transfer rules. Reorder based on what is moving, not on what you wish would move. If you want a broader operating view on managing ecommerce inventory for SMEs, that's a useful companion read.
A simple triage framework I use
When a product lags, I run through this list in order:
- Is the issue isolated or broad? If it's only one size or one channel, don't punish the whole product.
- Did the customer see it? If no, this is a visibility problem.
- Did the customer understand it? If no, fix copy, image order, and offer clarity.
- Did the customer want it but hesitate? If yes, test price, bundle, or urgency.
- Did I place too much stock in the wrong spot? If yes, move inventory before you mark it down.
That's how you improve sell through rate without guessing. Diagnose first. Then act.
Tracking Your Rate Without Fancy Software
You do not need expensive software to start tracking sell through rate.
A spreadsheet works. In the early days, I prefer it. Manual tracking forces you to look at the business instead of outsourcing your thinking to a dashboard.
![]()
What to put in your sheet
Keep it boring and usable. Add columns for:
- Product or SKU
- Units received
- Units sold
- Sell through rate
- Channel
- Notes
That last column matters more than people think. Write down things like “featured in email,” “price changed,” “restocked late,” or “moved to homepage.” Context makes the number useful.
If you sell across more than one platform, this guide to multichannel inventory management is a good next read because channel sprawl makes tracking harder fast.
How often to update it
Pick a cadence you'll consistently maintain. Weekly is great if volume is high or product launches happen often. Monthly is fine if the business is smaller or the buying cycle is slower.
What matters is consistency.
Here's a simple routine:
| Step | What to do |
|---|---|
| Export sales | Pull sales data from Shopify, Amazon, Faire, or wherever you sell |
| Update receipts | Log what inventory came in during the period |
| Calculate rate | Apply the same formula every time |
| Add notes | Record promotions, stockouts, and merchandising changes |
| Review outliers | Find products that need action |
When to upgrade
Eventually, spreadsheets get annoying. That's usually the signal to add software, not the first missed cell.
Upgrade when:
- You sell across many channels
- You transfer stock between locations
- You need tighter replenishment planning
- You can't trust the manual process anymore
Until then, don't hide behind tool shopping. Start scrappy. The founder who reviews a plain Google Sheet every week often has better instincts than the founder with expensive software and no discipline.
If you're building a brand in the Midwest and want honest feedback from operators who've lived this stuff, check out Chicago Brandstarters. It's a free community for kind, hard-working founders who want real conversations, not networking theater.
Leave a Reply