
Let's cut to the chase: the inventory turnover formula is just Cost of Goods Sold ÷ Average Inventory.
Don't let the accounting jargon trip you up. This simple piece of math reveals how many times you sell out and restock your entire inventory in a given period. For any e-commerce brand, it's one of the most vital health checks you can perform.
Your E-commerce Health Check in One Metric
Imagine your inventory as stacks of cash sitting on warehouse shelves. The faster you can turn that inventory over, the faster you convert that "shelf cash" back into real, usable profit.
The inventory turnover formula isn't just another line item for your accountant. It's a compass for building a resilient business and a core part of any smart e-commerce growth strategies.
Picture your business's cash flow like a river. A healthy river is always moving, powerful and full of life. When your inventory turnover is high, your business is just like that—strong, fluid, and building momentum.
Why This Metric Matters So Much
A low turnover rate? That’s a stagnant pond. Your cash gets trapped in products that aren't selling, driving up storage costs and risking your inventory becoming old, dusty, and worthless.
This single number forces you to ask curious, essential questions:
- Are we buying way too much of the wrong stuff?
- Is our marketing actually moving the products we have in stock?
- Is our cash needlessly tied up on a pallet rack somewhere?
Getting a handle on this formula is your first step to dodging the cash flow traps that smother so many young brands. It empowers you to make smarter, data-backed decisions, stop overstocking, and free up your capital to pour back into growth.
The classic formula is beautifully simple. Let's walk through a real-world example using 2022 fiscal data.
Say a company had a Cost of Goods Sold (COGS) of $500,000. Their inventory at the start of the year was $50,000, and at the end, it was $70,000.
First, find the average inventory: ($50,000 + $70,000) / 2 = $60,000.
Then, divide COGS by that average: $500,000 ÷ $60,000 = 8.33. This means the company sold through its entire stock more than eight times that year. That's a healthy flow.
If you want to go deeper, you can find more insights about inventory turnover ratios on mrpeasy.com and see how manufacturing pros put this to work. Nailing this core concept is the foundation for building a more resilient and profitable brand.
Calculating Your Inventory Turnover Ratio
Alright, let's get our hands dirty and actually calculate this thing. You don't need an accounting degree, I promise. Once you get the hang of it, you’ll see it’s a surprisingly simple formula that puts you firmly in control of your brand's financial pulse.
There are two main ways to run the numbers. One uses your Cost of Goods Sold (COGS), and the other uses Net Sales. Each gives you a slightly different perspective on your business's performance.
The Two Core Formulas
The COGS method is the gold standard. Think of it as the purest measure of your operational hustle. It completely ignores your pricing, markups, or any weekend flash sales you ran. It just tells you, straight up, how efficiently you’re moving physical units off your shelves. This is the one you’ll want to use for your own internal check-ups.
Then there’s the Net Sales method. It’s often quicker to pull the numbers for, but it can be a bit misleading. Why? Because your pricing strategy affects it. Run a massive 50% off sale, and your revenue might shoot up, making your turnover look incredible. But in reality, you might not have moved that much more inventory. This is exactly why knowing how to price a new product from the get-go is so critical for keeping your metrics honest.
This diagram breaks down the components of the classic COGS formula. It’s the most reliable way to see what's really going on.
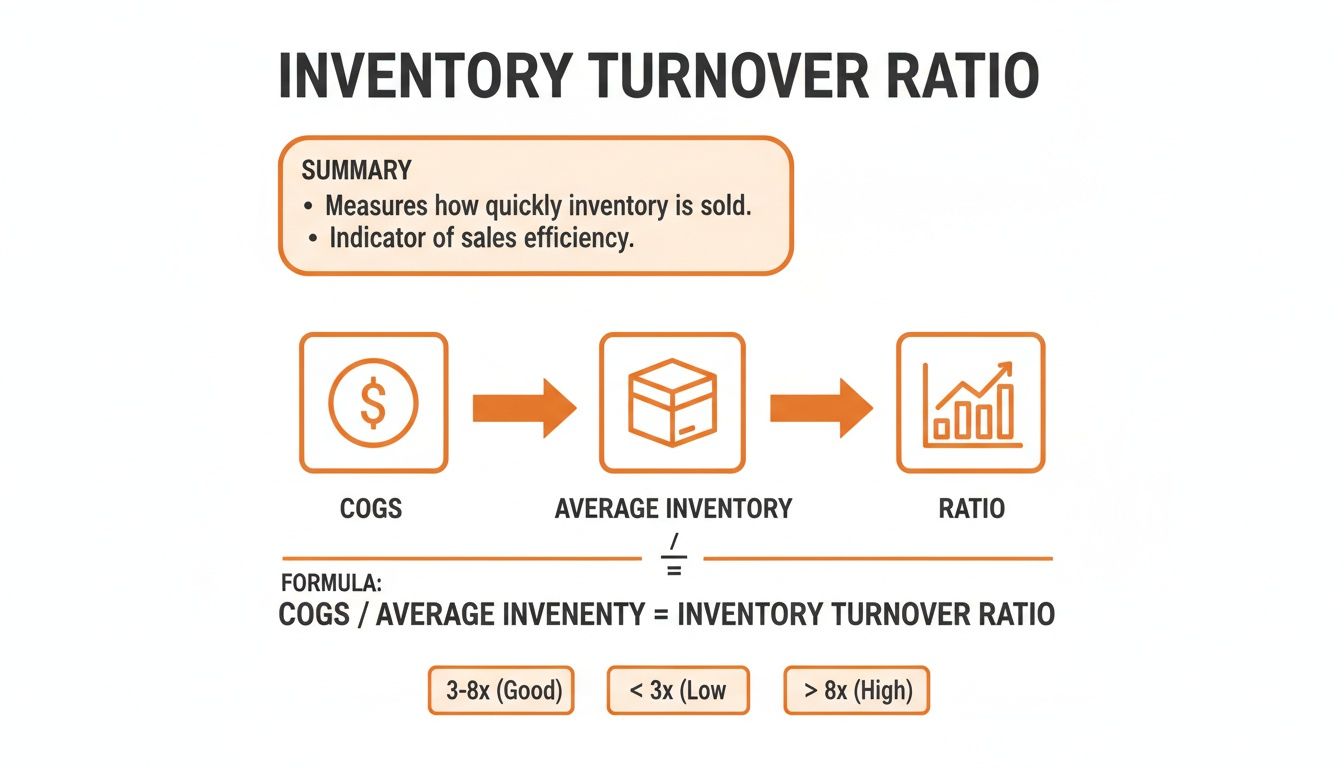
It really just comes down to one core idea: how the cost of what you sold compares to the cost of what you were holding.
Inventory Turnover Ratio = Cost of Goods Sold (COGS) ÷ Average Inventory
That's it. This number tells you how many times you sold through and replenished your entire stock in a given period. It’s the clearest snapshot you’ll get of how effectively you’re turning physical products into cold, hard cash.
COGS vs Sales Formula At a Glance
Here's a quick comparison to help you decide which formula makes the most sense for what you're trying to figure out.
| Aspect | COGS-Based Formula (COGS / Avg. Inventory) | Sales-Based Formula (Net Sales / Avg. Inventory) |
|---|---|---|
| Primary Focus | Measures the physical movement of inventory. Pure operational efficiency. | Measures turnover based on revenue generated from inventory. |
| Accuracy | More accurate for internal analysis. Not skewed by pricing or promotions. | Can be misleading. A big sale can inflate the ratio without more units sold. |
| Best For | Operations managers, inventory planners, internal financial health checks. | Quick, high-level comparisons, especially if COGS data is not readily available. |
| Main Takeaway | "How many times did we sell through our actual stock?" | "How much revenue did we generate for every dollar tied up in inventory?" |
For most product founders trying to get a real handle on their operations, the COGS-based formula is the way to go. It gives you the unvarnished truth.
A Practical E-commerce Example
Let's walk through this with a real-world scenario. Imagine you run a growing e-commerce brand selling handcrafted leather goods.
Annual Calculation Example:
- First, find your COGS for the year. Let's say from January 1st to December 31st, your total COGS was $200,000.
- Next, get your Average Inventory. You just need two numbers: the value of your inventory at the start of the year and at the end.
- Beginning Inventory (Jan 1st): $40,000
- Ending Inventory (Dec 31st): $60,000
- Average Inventory = ($40,000 + $60,000) ÷ 2 = $50,000
- Now, do the math. Just plug those numbers into the formula.
- Turnover Ratio = $200,000 (COGS) ÷ $50,000 (Average Inventory) = 4
Boom. A turnover ratio of 4 means your brand sold through its entire inventory four times during the year. Simple as that. You're basically turning over your stock once every quarter.
Quarterly Calculation Example (The Q4 Holiday Rush):
But what about a shorter, more intense period? Let's zoom in on the fourth quarter (October 1st to December 31st) when things get crazy.
- Q4 COGS: The holidays were good to you, so your COGS for the quarter was $75,000.
- Q4 Average Inventory:
- Beginning Inventory (Oct 1st): $60,000
- Ending Inventory (Dec 31st): $40,000 (You sold a ton!)
- Average Inventory = ($60,000 + $40,000) ÷ 2 = $50,000
- Calculate the Ratio:
- Turnover Ratio = $75,000 ÷ $50,000 = 1.5
For Q4 alone, you turned your inventory 1.5 times. This kind of focused view is powerful. It shows you the real impact of seasonality and gives you actual data to plan your purchasing for next year's peak season instead of just guessing.
What Your Turnover Ratio Is Really Telling You
So, you’ve wrestled with the numbers and have your inventory turnover ratio. Maybe it’s a 4, an 8, or even a 12. But a number on its own is just data, not a story. What is that number really telling you about the health of your business?

Think of your business like a neighborhood bakery. Your goal is to sell every single loaf of bread by the end of the day. A high turnover ratio is the equivalent of an empty shelf at closing time—every dollar you spent on flour and yeast was turned into profit. It’s fresh, efficient, and what you’re aiming for.
A low turnover ratio? That’s a shelf full of stale, day-old bread. It’s a sunk cost. Your cash is trapped in those unsold loaves, taking up space and losing value with every passing hour. This single metric is a powerful diagnostic tool, revealing the hidden story behind your sales and operations.
High Turnover: The Good and The Bad
A high turnover ratio usually feels like a massive win. And often, it is! It signals strong sales, fresh inventory, and efficient management. You’re clearly selling products that people want, and your cash isn’t getting stuck on shelves.
But an extremely high ratio can be a warning sign. It might mean you’re playing it too safe and understocking. Are you constantly running out of your bestsellers, frustrating loyal customers and sending them straight to your competitors? A sky-high ratio could be masking lost sales opportunities, which is just as damaging as overstocking. It’s a delicate balance.
Low Turnover: The Obvious Problem
A low turnover ratio is a much more straightforward problem to diagnose. It almost always means your products are sitting around for way too long. This creates a cascade of painful issues:
- Trapped Cash: Every unsold product is capital you can't reinvest into marketing, new product development, or just paying the bills.
- Increased Holding Costs: You’re paying for storage, insurance, and security for items that aren't making you money.
- Risk of Obsolescence: In many industries, products have a shelf life. Fashion goes out of style, electronics become outdated, and packaged goods expire.
A low ratio is a clear signal that something is off. It could be weak marketing, a mismatch between your product and your audience, or simply overly optimistic purchasing. It's a call to action to figure out why your "bread" is going stale.
Finding Your Sweet Spot with Benchmarks
So, what’s a “good” number? It’s wildly different for every industry. Context is everything. A grocery store selling perishable milk and eggs might aim for a turnover of 20+, while a luxury furniture maker could be perfectly healthy with a ratio of 1.5.
Historically, U.S. manufacturers have seen their averages evolve from 4-6 turns in the 1990s to over 7 as they adopted leaner practices. Data suggests that small businesses with ratios below 2 face a significantly higher risk of failure. You can find more detailed industry turnover benchmarks at Wall Street Prep.
Your real goal isn’t to hit some magic universal number. It’s to understand what’s normal for your specific market and, most importantly, to focus on consistently improving your own ratio over time. A steady increase from 4 to 5 is a much stronger sign of health than wildly swinging from 2 to 10.
Common Mistakes That Distort Your Numbers
Your inventory turnover formula is like that brutally honest friend who tells you the truth, even when you don’t want to hear it. But its honesty is only as good as the numbers you give it. Feeding it bad data is like using a GPS with a five-year-old map—it’ll give you directions, but they won't get you where you actually need to go.
Even a tiny error can throw your results way off, giving you a false sense of security or sparking a panic you didn't need to have. Let's make sure you can trust what your numbers are telling you.
Ignoring Your Dead Stock
This is one of the easiest traps to fall into. We all have it: that obsolete or "dead" stock sitting on a shelf, gathering dust for years. It's not selling, and let's be real, you're probably never going to sell it at full price.
When you include this stuff in your average inventory calculation, it inflates your inventory value and artificially drags your turnover ratio down. The result? You look a lot less efficient than you actually are.
Key Takeaway: You have to be ruthless here. Write off or liquidate that obsolete inventory. Getting it off your books gives you a much clearer, more accurate picture of how your real, sellable products are actually moving.
This isn't just an accounting task; it’s a strategic move that sharpens your operational vision.
Forgetting About Seasonality
Your business has a rhythm, a pulse. For most e-commerce brands, sales in Q4 look completely different from sales in Q2. If you only calculate your turnover ratio once a year, you’re missing the whole story.
An annual number just smooths out all the critical peaks and valleys, hiding the insights you desperately need. A low annual ratio might be masking a killer holiday season, while a decent-looking one could be covering up a dangerously slow summer.
Here’s how to fix it:
- Calculate Quarterly: At a bare minimum, run your numbers every quarter. This will show you how turnover ebbs and flows with the seasons.
- Track Monthly: For fast-moving products or during your most important sales periods, monthly calculations give you the granular control you need to make smart decisions on the fly.
This kind of discipline helps you gear up for demand spikes and manage your cash when things inevitably slow down.
Inconsistent Accounting Methods
How you value your inventory—whether you use FIFO (First-In, First-Out) or LIFO (Last-In, First-Out)—directly changes your Cost of Goods Sold and ending inventory numbers. If you flip-flop between methods, your year-over-year comparisons become totally meaningless.
It’s like changing the rules of a game halfway through. You can't tell if you're actually improving or if the score is just different because the rules changed. The same goes for your accounting; consistency is what allows you to track real progress over time. It's a foundational piece, just as important as the first steps you take when you learn how to find a manufacturer for your product.
Pick an accounting method and stick with it. That way, when your inventory turnover ratio moves, you know it reflects a real change in your business, not just a tweak in your bookkeeping.
Actionable Strategies to Improve Your Turnover Rate
Knowing your inventory turnover ratio is like stepping on a scale. The number itself doesn't change anything, but it gives you a brutally honest look at where you stand. The real work starts now—turning that number into a plan to build a stronger, more profitable business.
Improving your turnover is all about creating a healthier cash flow through your brand. It’s about being smarter, not just busier. These strategies are a practical playbook for getting that cash moving, freeing up your capital, and building a more resilient operation.
Master Your Demand Forecasting
Over-ordering is the #1 killer of a healthy turnover ratio. It's the equivalent of cooking a feast for ten people when only three are coming to dinner—wasteful and expensive. Nailing your demand forecasting is the cure.
Stop relying on gut feelings and start digging into your data. Look at past sales, spot the seasonal peaks and valleys, and get ruthless about tracking the sales velocity of every single product.
- Review Historical Sales: Pull your sales data from the last 12-24 months. Figure out which products are your consistent sellers and which ones are just collecting dust.
- Factor in Seasonality: Don't treat June the same as December. You need to order more inventory ahead of your peak seasons and pull way back during the slow months.
- Use Simple Tools: You don't need fancy software to get started. A well-organized spreadsheet can show you powerful patterns about what your customers actually want and when they want it.
Better forecasting helps you order what you need, not just what you think you'll sell.
Implement Smarter Pricing and Promotions
Your pricing is a huge lever you can pull to get inventory moving. For those products that are sitting on the shelf a little too long, a smart discount or promotion is the nudge they need.
This isn't about running endless fire sales. We're talking about targeted, strategic moves to clear out stagnant stock and pump cash back into your business.
Think of it this way: a slow-moving product is like a parked car taking up a valuable spot. A small discount is the price of the tow truck to clear the space for a car that will actually pay rent. It’s often cheaper to sell at a small loss now than to pay holding costs for another six months.
Try a few of these tactics:
- Product Bundling: Pair a slow-moving item with a bestseller. This bumps up the perceived value and helps you move the less popular product without a massive discount.
- Flash Sales: Create some urgency with a limited-time offer on specific items. This is perfect for clearing out seasonal inventory before it becomes totally irrelevant.
- Tiered Discounts: Run offers like "Buy 2, Get 1 50% Off" on certain categories. It encourages bigger orders and clears out stock way faster.
Strengthen Your Supplier Relationships
Your relationship with your suppliers can make or break your inventory flexibility. If you're stuck with massive minimum order quantities (MOQs), it's almost impossible to stay nimble. A strong, open partnership can unlock much better terms.
Start a conversation with your suppliers. Tell them you're focused on improving your inventory efficiency. You might be surprised how willing they are to work with you, especially if you're a good partner.
Ask them about things like:
- Lower MOQs: Even a small drop here can make a huge difference in how much cash you have tied up in a single PO.
- Faster Lead Times: Quicker replenishment means you can hold less safety stock, which naturally improves your turnover.
- Flexible Payment Terms: Better terms give your cash flow more breathing room so you can manage your inventory without panicking.
Still Have Questions? Let's Clear a Few Things Up.
Even after you've got the formula down, a few common questions always seem to pop up. Think of this as the final once-over before you start fine-tuning your business operations.
We’ve covered the "what" and "how"—now let’s get a few more details straight.
How Often Should I Calculate My Inventory Turnover?
For most e-commerce brands, running the numbers quarterly is the sweet spot. It's often enough to catch trends and seasonal shifts without getting bogged down in the daily noise.
But if you're in a fast-moving space—think fast fashion or anything perishable—you absolutely need to calculate this monthly. No excuses. This gives you the near-real-time feedback you need to stay on your feet.
An annual calculation is still good for big-picture stuff, like year-end financials or talking to investors. But it's way too broad to help you make smart operational decisions day-to-day. A bad quarter can easily get lost in a decent-looking annual number. The key is consistency: pick a timeframe and stick with it so your comparisons actually mean something.
What's a Good Inventory Turnover Ratio for E-commerce?
Honestly, there's no single "magic" number. This metric is super industry-specific. As a general rule of thumb, a lot of e-commerce brands aim for a ratio somewhere between 4 and 6. This usually means you’re keeping enough stock on hand without tying up a ton of cash.
But context is everything.
- A dropshipping business might have an insane ratio because they don't hold any inventory.
- A founder selling high-end, custom furniture could be killing it with a ratio closer to 2.
Your real goal shouldn't be to chase some generic industry average. The smart move is to see what your direct competitors are doing and then—this is the important part—focus on improving your own ratio over time. A steady upward trend is the best sign of a healthy, efficient operation.
Can My Inventory Turnover Be Too High?
You bet. It’s a classic mistake to think that higher is always better. While a high number often signals strong sales, an extremely high ratio can be a serious red flag that you're under-stocking.
It probably means you're constantly selling out of your best products. That leads to stockouts, which means frustrated customers, lost sales, and a damaged reputation when people go buy from your competitor instead.
It can also mean you're buying inefficiently. Placing tons of small, frequent orders might feel nimble, but you're probably missing out on bulk discounts and paying way more in shipping costs. Both of those will eat directly into your margins. The goal is balance—maximizing sales without ticking off customers or tanking your profitability.
Does This Formula Work for Service-Based Businesses?
Nope. The inventory turnover formula is strictly for businesses that sell physical products. If you run a service-based company—like a marketing agency, a consultancy, or a SaaS business—you don't have inventory, so this metric is totally irrelevant.
Instead, service businesses have their own set of KPIs to track their health and efficiency. They live and die by numbers like:
- Customer Acquisition Cost (CAC): What it costs you to get a new customer in the door.
- Customer Lifetime Value (LTV): The total amount of money you expect to make from a single customer.
- Monthly Recurring Revenue (MRR): Your predictable income stream every single month.
These are the metrics that tell the real story for a service business, the same way inventory turnover does for a product brand.
Building a brand is tough, and the journey can feel isolating. At Chicago Brandstarters, we believe you shouldn't have to build alone. We are a free, vetted community for kind and bold founders in the Midwest, offering a space for honest conversations, real-world tactics, and genuine support. If you value hard work and kindness and want to grow alongside peers who get it, we invite you to learn more and join us at https://www.chicagobrandstarters.com.